


Donchian Channels vs Bollinger Bands: Which Is Better?
FXOpen
Donchian Channels and Bollinger Bands are technical analysis indicators that both use three lines – an upper, a middle, and a lower band – to measure volatility and generate trading signals. While they may appear to be similar on a price chart, there are instances in which Bollinger Bands can be more effective than Donchian Channels and vice versa.
What is the difference between Bollinger Bands and Donchian Channels, and how should you use them? In this FXOpen article, we compare the two indicators and explain when to choose one over the other.
What Are Bollinger Bands?
US financial analyst John Bollinger developed the concept of Bollinger Bands in the 1980s. They calculate upper and lower trendlines as two standard deviations from a simple moving average (SMA) to indicate volatility. The distance between the lines shows relative changes in volatility – the wider the bands, the higher the volatility, and the narrower the bands, the lower the volatility.
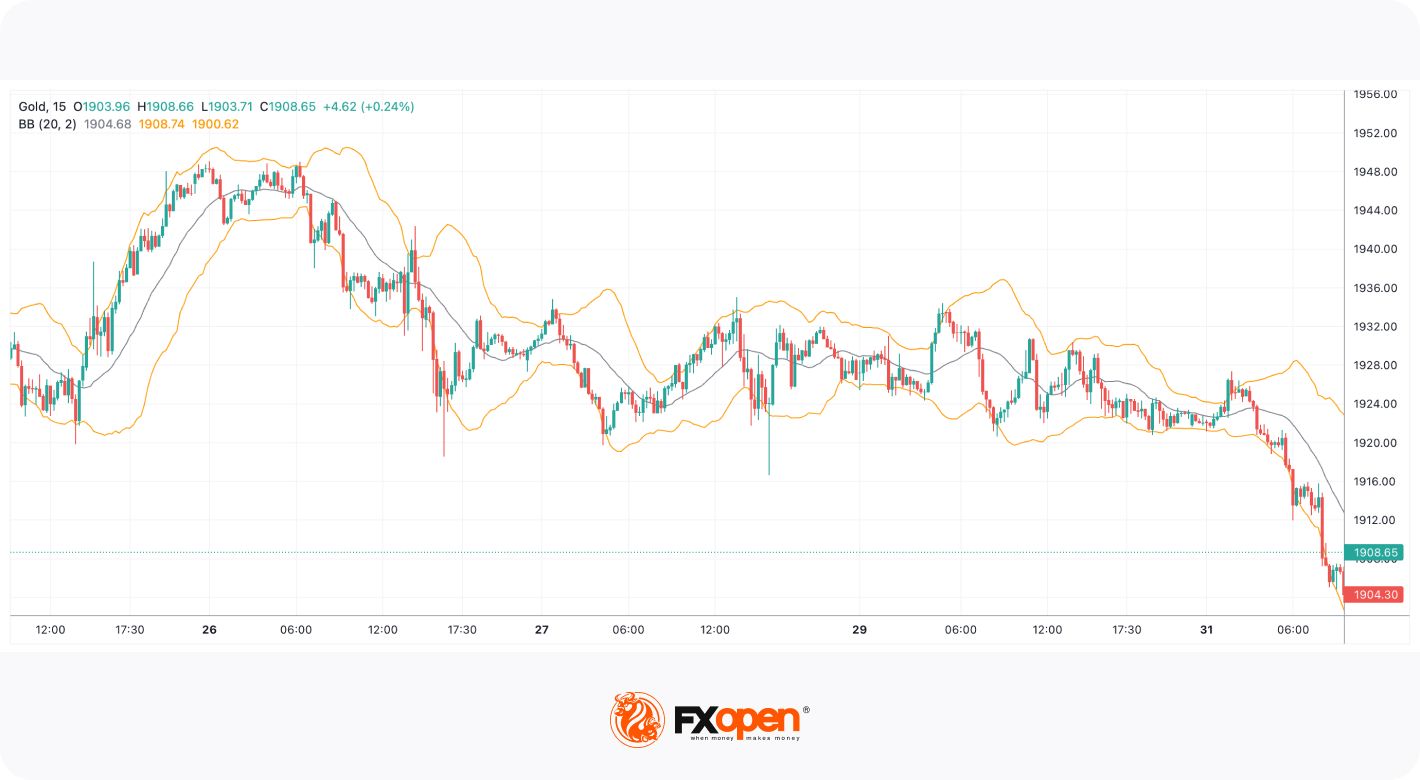
The standard deviation sets the distance between the bands and the SMA and is typically 2, but it can be changed to reduce the noise in a highly volatile market. The standard period for the calculation is 20, but this is also adjustable depending on the market and the timeframe.
How to Use Bollinger Bands
Track Volatility
Bollinger Bands adapt dynamically to prices moving higher and lower as volatility rises and falls, with the distance between them widening and narrowing in line with the price movement. When volatility increases, the top and bottom lines move away from the middle SMA, and when volatility falls, they move closer to the line. Reduced volatility indicates there is potential for the market to gain momentum in the future.
Set Entry and Exit Points
The indicator can determine when an asset is overbought or oversold and provide entry and exit points accordingly. You would open a long position when the price moves beyond the bottom band, with the upper band as a profit target and the middle line as another potential target for a conservative approach. As the price bounces off the upper line, you would use the bottom line as a target.
This strategy is based on mean reversion, which is explained as the assumption that if an asset value deviates widely from the average, it will revert back eventually. Entering a trade when the price bounces off a band is effective in a rangebound market and on high timeframes but may be risky. To be more conservative, you might wait for the asset to break above or below the SMA.
What Are Donchian Channels?
Futures and commodities trader Richard Donchian developed Donchian Channels in the 1960s to spot emerging trends, gauge the strength of breakouts, and identify potential reversal points.
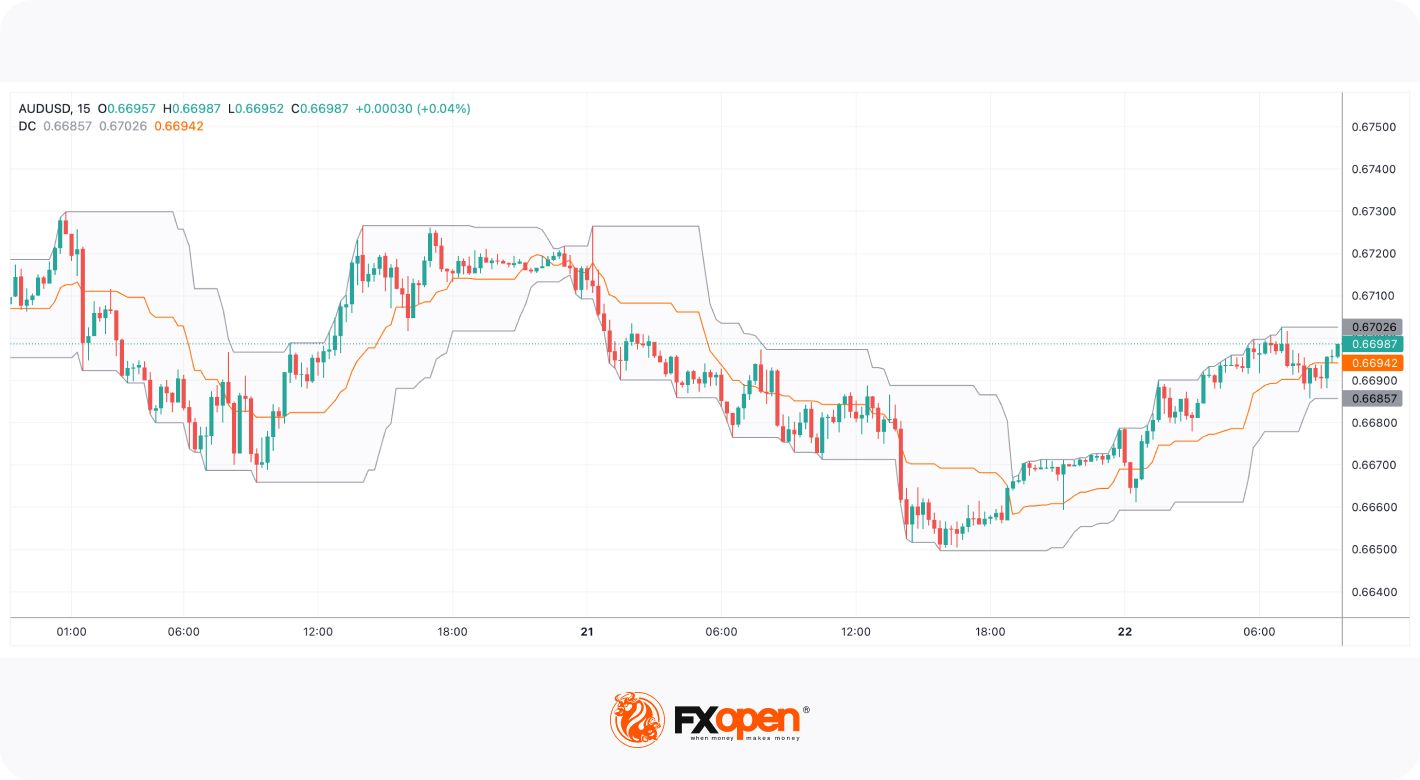
Like Bollinger Bands, the channels comprise three lines. But rather than using standard deviations, the lines are based on the lowest and highest values for an asset over a given period. The middle line is then calculated by dividing the sum of the upper and lower values by 2. Channels are also set to 20 periods by default. Adjusting the indicator to a smaller number of periods increases its responsiveness but can also create more noise and produce false signals, while a larger number can offer fewer but more accurate alerts.
How to Use Donchian Channels
Track Volatility
Like Bollinger Bands, you can use Donchian Channels to measure volatility. During periods of high volatility, the difference between the lowest lows and highest highs is likely to be greater, which is shown by a widening channel. When volatility falls, the channel narrows.
Identify Trends
In a strong market trend, the price can make higher highs or lower lows than the previous 20 periods. If the upper line moves consistently higher while the bottom one holds flat, the market is likely gaining bullish momentum. Conversely, if the bottom line moves down consistently while the upper one holds flat, the market is likely gathering bearish momentum.
Trade Breakouts
Channels can identify breakouts above or below the middle line, which acts as a moving average. When an asset moves above the middle, it may be considered bullish, and when it moves below the line, it may be bearish, offering a signal to enter or exit a trade. As prices can reach a higher high or lower low before reversing direction, the indicator is more effective when you look for multiple touches in the direction of the trend to confirm the breakout.
Trade Reversals
In a rangebound market, the lower and upper bands can represent areas of support and resistance, respectively. If the price touches the upper line, you could close a long position or open a short position in the expectation that it will bounce lower off the resistance level. If the asset approaches the bottom line, you could close a short position or open a long one.
Differences Between the Donchian Channel and Bollinger Bands
Both indicators are similar in how they appear, how they measure volatility, and how they respond to changes in volatility, but there are important differences between them.
Calculations
Donchian Channels are based on the extreme highs and lows over a specified period, whereas Bollinger Bands are based on standard deviations to prevent outliers from distorting the data.
While Bollinger Bands are based on the SMA line, the middle line in a Donchian Channel is an average of the upper and lower bands.
Breakout Interpretation
When an asset breaks above the upper line or below the lower line of the Bollinger Bands, this is interpreted as a potential trend reversal. But when using the Donchian Channel indicator, a breakout indicates that the price could be developing a new trend after breaking out of its recent trading range.
When Should You Use Bollinger Bands?
Early Trade Entries and Exits
Bollinger Bands react faster to changes in a market, providing early trade signals for better positioning. The SMA used as the middle line provides further support in identifying entry and exit points.
Trading Highly Volatile Assets
Bollinger Bands are dynamic to adjust to high market volatility, whereas Donchian Channels are not. They do not incorporate current asset value into their calculations, which can cause a lag in the indicator as the most recent price is significant in highly volatile markets.
Dynamic Trading
Active traders or scalpers tend to prefer Bollinger Bands as they react faster to changing market conditions, allowing them to capitalise on a greater number of trading opportunities.
When Should You Use Donchian Channels?
Low-Risk Trading
Donchian Channels are more suitable for risk-averse traders because, although Bollinger Bands react quickly to price changes, this tends to introduce more risk.
Trading Choppy Markets
The early entry signals that Bollinger Bands provide are more likely to offer false trading signals when there are temporary price fluctuations, such as when a market is choppy or lacks clear direction. Donchian Channels provide insights that help to identify trends from sideways market movement.
Final Thoughts
Bollinger Bands and Donchian Channels are both frequently used technical analysis indicators that can help you to make trading decisions. While there are similarities between them, there are key differences that can make one more suitable than the other. Deciding whether to use Donchian Channels vs Bollinger Bands will depend on your trading strategy and the nature of the market you are looking to trade.You can open an FXOpen account to practise using technical indicators on the TickTrader platform and incorporate them into your trading.
This article represents the opinion of the Companies operating under the FXOpen brand only. It is not to be construed as an offer, solicitation, or recommendation with respect to products and services provided by the Companies operating under the FXOpen brand, nor is it to be considered financial advice.
Stay ahead of the market!
Subscribe now to our mailing list and receive the latest market news and insights delivered directly to your inbox.


Latest articles

Ethereum: Market Assesses the Strength of the Corrective Recovery
Following a period of heightened volatility in early June, investor attention in Ethereum has once again shifted towards institutional demand and the development of the spot ETF market in the United States. The funds launched last year continue to serve

Ripple: Letter to Congress Stirs the Crypto Market
At the beginning of June, more than 200 crypto companies and industry groups — including Coinbase, Andreessen Horowitz and Ripple Labs — sent a letter to Senate Majority and Minority Leaders John Thune and Chuck Schumer, urging them to bring the Digital

GBP/JPY: Ascending Triangle Under Pressure
The GBP/JPY pair has come under pressure after the Bank of Japan raised its policy rate to 1.0% on 16 June. The Bank of England is following the opposite path: at its 30 April meeting, the Monetary Policy