


Effective Price Action Trading Strategies
FXOpen

Dive into the intricacies of price action trading, an analytical method hinging on pure price movements. By studying price action, indicators take a backseat. Instead, traders harness the power of charts to predict potential market shifts. This article unravels four strategies that allow traders to navigate market waves with actionable insights.
What Is Price Action Trading?
Price action trading is a method that focuses on the analysis of raw price movements rather than relying on external indicators. Traders scrutinise historical and real-time price data—often represented through charts—to forecast future price movements. This approach emphasises patterns, structures, and behaviours within market prices, allowing traders to make informed decisions based solely on price dynamics.
To follow along with these strategies, head over to FXOpen’s free TickTrader platform and start in minutes.
Trend Pullback Trading: Maximising Market Momentum

Trend pullback trading is a strategy that leverages the inherent rhythm of the market—taking two steps forward and one step back. While trends in financial markets can be strong, they rarely move in straight lines. This strategy capitalises on these minor retracements within a broader trend and is one of the best-recognised price action forex strategies.
Entry/Exit Criteria
Entry
- For an upward trend, the market establishes a new bullish leg, or for a downward trend, the market confirms a new bearish leg.
- Price subsequently retraces into the previous high-low range.
- Long positions are viable at support levels within this range, while short positions are suitable at resistance levels. Alternatively, traders can consider an entry at the 50% retracement level from the recent swing high or low.
Stop Losses
- For long entries, traders may consider placing the stop loss slightly below the support or the low of the high-low range.
- For short entries, one could set the stop loss just above the resistance or the high of the high-low range.
Take Profits
- You may consider taking profits when the price approaches a significant support/resistance level or moves beyond the high/low of the range, depending on the direction of the trade.
Breakout Trading: Harnessing Trend Shifts
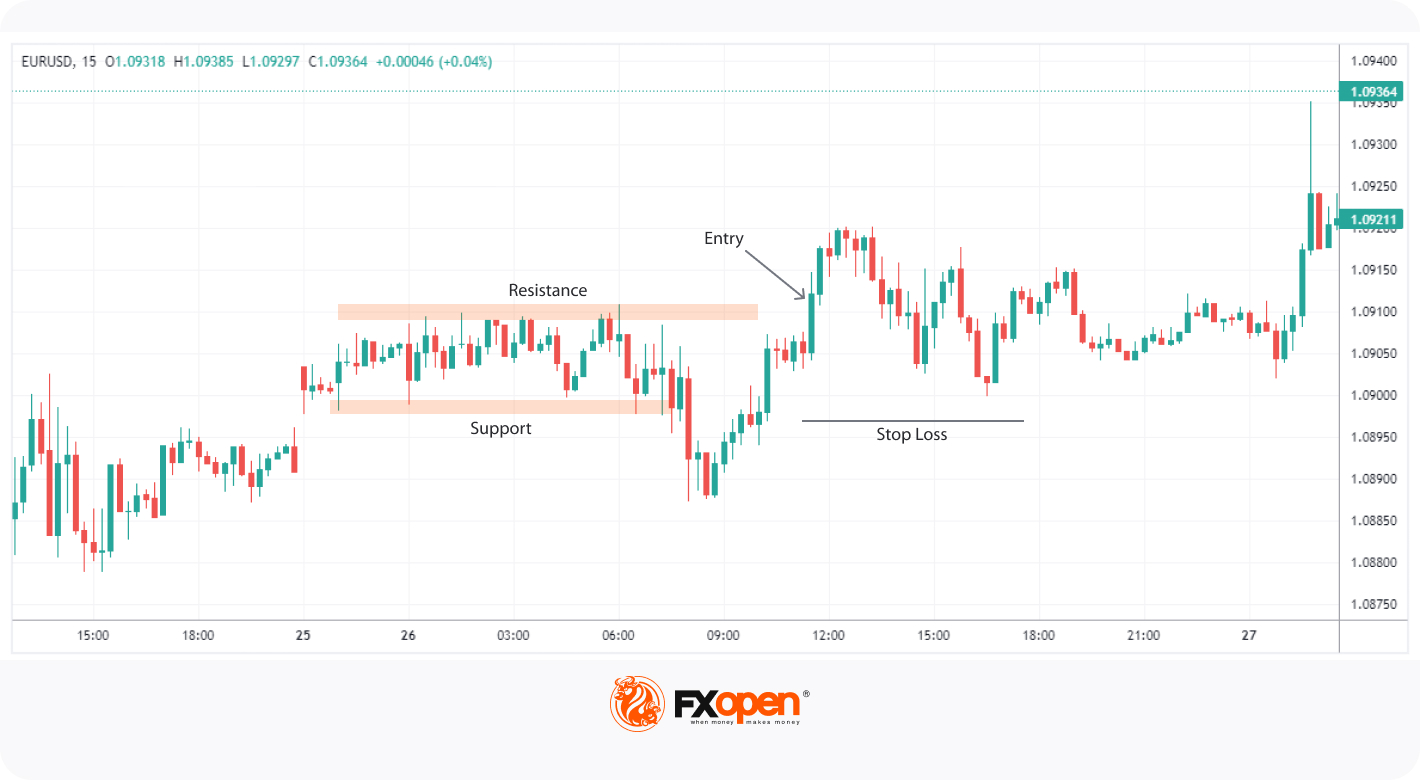
Breakout trading is a strategy that captures significant price movements when an asset breaks through established levels of support or resistance. Such breakouts often signal a change in market sentiment, indicating the potential for a sustained move in the breakout direction. Breakout traders aim to enter a position as the price makes its move, capitalising on the subsequent momentum.
Entry/Exit Criteria
Entry
- When the price surpasses a well-defined resistance level, traders often consider this as a potential long entry point.
- Conversely, when the price drops below a clear support level, it can be viewed as a potential short entry opportunity.
Stop Losses
- For long breakout trades, a common approach is to set the stop loss slightly below the breached resistance, which might now act as support.
- For short breakout trades, traders often position the stop loss just above the penetrated support, which can then act as resistance.
Take Profits
- For long entries, taking profits might be considered when the price reaches a subsequent resistance level or displays signs of exhaustion.
- For short trades, profits could be captured as the price approaches a following support level or shows weakening momentum.
Pin Bar: One of the Most Common Price Action Patterns
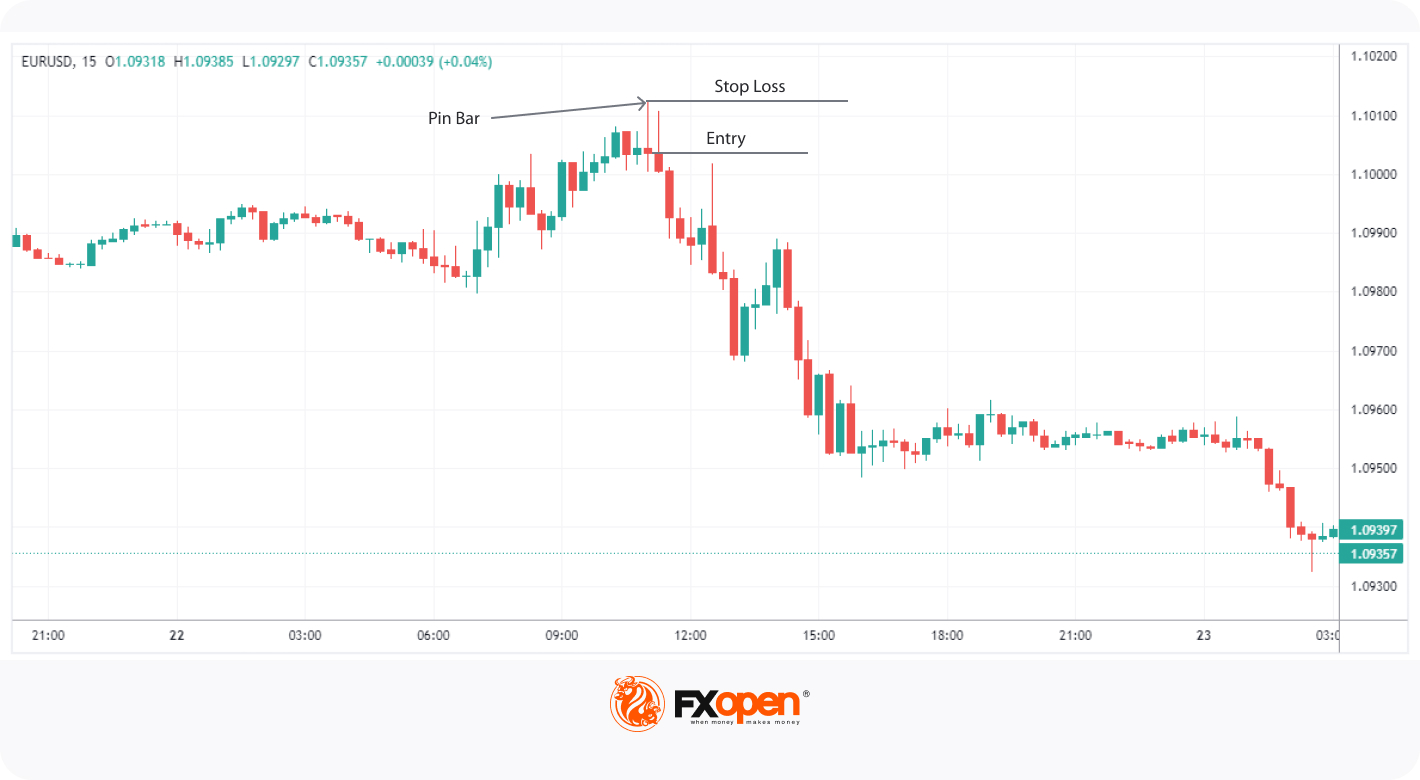
The Pin Bar is a distinct candlestick pattern that can signal potential price reversals in the market. Characterised by a small body with a long wick or 'tail', its shape resembles a pin, hence the name. The length of the tail suggests a strong rejection of prices, indicating that traders pushed the asset in one direction, but it couldn't maintain that level by the close of the period.
Entry/Exit Criteria
Entry
- When a Pin Bar forms after a downtrend and has a long downward tail, traders often view it as a potential sign of upcoming bullish momentum and enter on the close of the candle.
- Conversely, a Pin Bar with a long upward tail after an uptrend can suggest potential bearish sentiment, with many entering at the close.
Stop Losses
- For bullish Pin Bars, traders might position the stop loss slightly below the tail's low.
- For bearish Pin Bars, one might consider placing the stop loss just above the tail's high.
Take Profits
- For long entries following a bullish Pin Bar, profits might be targeted near the next resistance level or a predetermined risk-to-reward ratio.
- For short entries after a bearish Pin Bar, profits could be aimed at the subsequent support level or set based on a desired risk-to-reward threshold.
Inside Bar: Benefiting From Market Consolidation
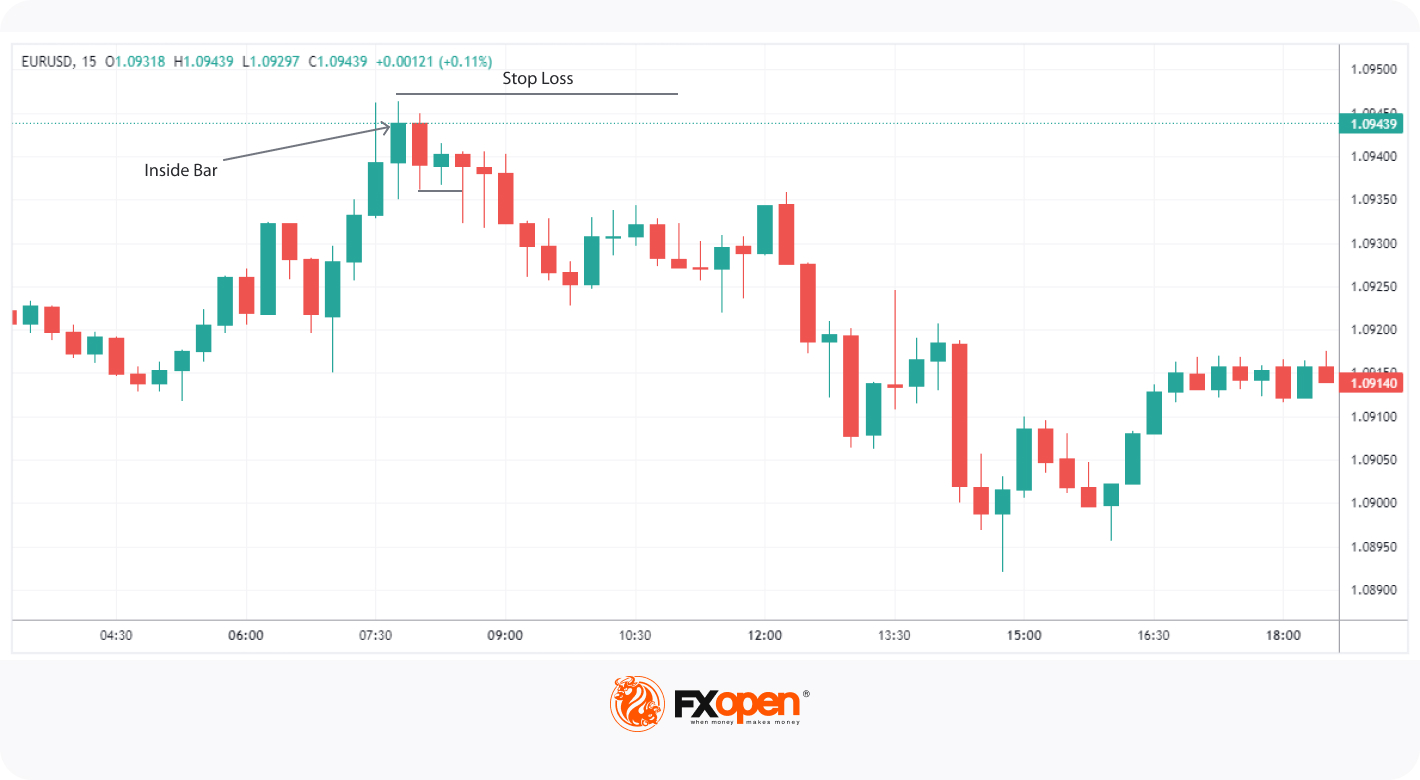
The Inside Bar is a candlestick pattern showcasing market indecision and potential continuation or reversal scenarios. As the name suggests, an Inside Bar is completely encompassed by the previous bar, meaning both its high and low are within the range of the prior candlestick. This pattern often reflects a pause in trend momentum, where market participants are assessing their next move.
Entry/Exit Criteria
Entry
- Traders frequently look for a break above the high of the Inside Bar as a potential long entry point, suggesting a continuation or bullish reversal.
- Conversely, a break below the Inside Bar's low can indicate a potential short entry, signalling a continuation or bearish reversal.
Stop Losses
- For long trades initiated by an upward break from the Inside Bar, placing the stop loss just below the Inside Bar's low is common.
- For short trades following a downward break, traders might consider a stop loss slightly above the Inside Bar's high.
Take Profits
- For long trades, taking profits can be considered at an upcoming resistance level or when there are signs of waning momentum.
- For short trades, profit targets might be set at an approaching support level or upon observing diminishing bearish momentum.
Ideas for Improving Your Price Action Trading Strategies
Learning how to read price action requires a blend of discipline, analysis, and continuous learning. While there are no price action trading secrets per se, there are many ways you may want to utilise to improve your process.
- Backtest Religiously: Before implementing a strategy, test it on historical data to assess its viability.
- Stay Updated: Markets evolve, and so should your strategies. Regularly review and refine them based on recent market behaviours.
- Manage Risk: Use stop losses and position sizing to ensure no single trade jeopardises your portfolio.
- Master Chart Patterns: Delve deeper into patterns like head and shoulders, triangles, and flags. Recognising these can enhance decision-making.
- Stay Patient: Wait for clear signals before entering a trade. Avoid chasing the market.
Final Thoughts
As you delve into the world of price action trading, remember that success lies in consistent practice and informed decision-making. None of the strategies can guarantee the success of your trading. Strategies are given as models and are transformed by each trader individually.
Once you’ve found a strategy you’re happy with, consider opening an FXOpen account. You’ll gain access to advanced charting tools to refine your trading strategy further and benefit from low-cost trading fees, lightning-fast execution speeds, and a whole host of markets to explore. Good luck!
This article represents the opinion of the Companies operating under the FXOpen brand only. It is not to be construed as an offer, solicitation, or recommendation with respect to products and services provided by the Companies operating under the FXOpen brand, nor is it to be considered financial advice.
Stay ahead of the market!
Subscribe now to our mailing list and receive the latest market news and insights delivered directly to your inbox.


Latest articles

Dow Jones (DJIA): Consolidation Beyond the Trend
Federal Reserve Chair Kevin Warsh testified before Congress on 14–15 July, reaffirming the Fed's commitment to bringing inflation back to target while providing no clear guidance on the future path of interest rates. Meanwhile, June inflation data came in

European Currencies Strengthen Ahead of Key Macroeconomic Releases
EUR/USD and GBP/USD continue to recover moderately following the recent weakening of the US dollar. European currencies have been supported by expectations that US inflationary pressures will continue to ease after softer-than-expected CPI and PPI data, reinforcing market

Brent Crude Oil: From Ceasefire to Crossfire — What's Next?
Just weeks ago, traders were pricing in peace. Now they're pricing in war again—and that reversal says everything about how fragile the current Middle East calm really is.
Brent crude has surged to $86 a barrel, its highest level