


Ascending Triangle in Trading: Theory and Practice
FXOpen
The ascending triangle is one of the most recognisable chart formations in technical analysis. Characterised by a flat upper boundary and a rising lower trendline, it reflects a gradual build-up of pressure in the market. This pattern is closely watched by traders across stocks, forex, commodities, and cryptocurrencies*, as it often precedes decisive price movement. In this article, we’ll explore how to identify the ascending triangle and apply it in trading.
What Is an Ascending Triangle?
An ascending or rising triangle is a bullish chart pattern that usually signals a trend continuation. It is framed by two trendlines. The upper line connects highs placed at almost the same level, while the lower line is angled and connects higher lows.
The triangle’s appearance is explained as follows: buyers try to push the price up, but they meet a strong resistance level, so the price rebounds. Still, buyers have strength, which is reflected in higher lows. Therefore, they continue pushing the price until it breaks above the resistance level. The period during which the price bounces back and forth between the two lines depends on the timeframe. On daily charts, the triangle can be in place for over a week.
Note: The ascending triangle is a continuation chart pattern but sometimes it can be used as a reversal signal. It happens when the ascending triangle occurs in a downtrend. It’s the biggest challenge of all the triangles.
The rising triangle is one of the setups in the triangle group. There are also descending and symmetrical formations.
Ascending, Descending, and Symmetrical Triangles: The Differences
The triangle group of patterns comprises ascending, descending, and symmetrical formations.
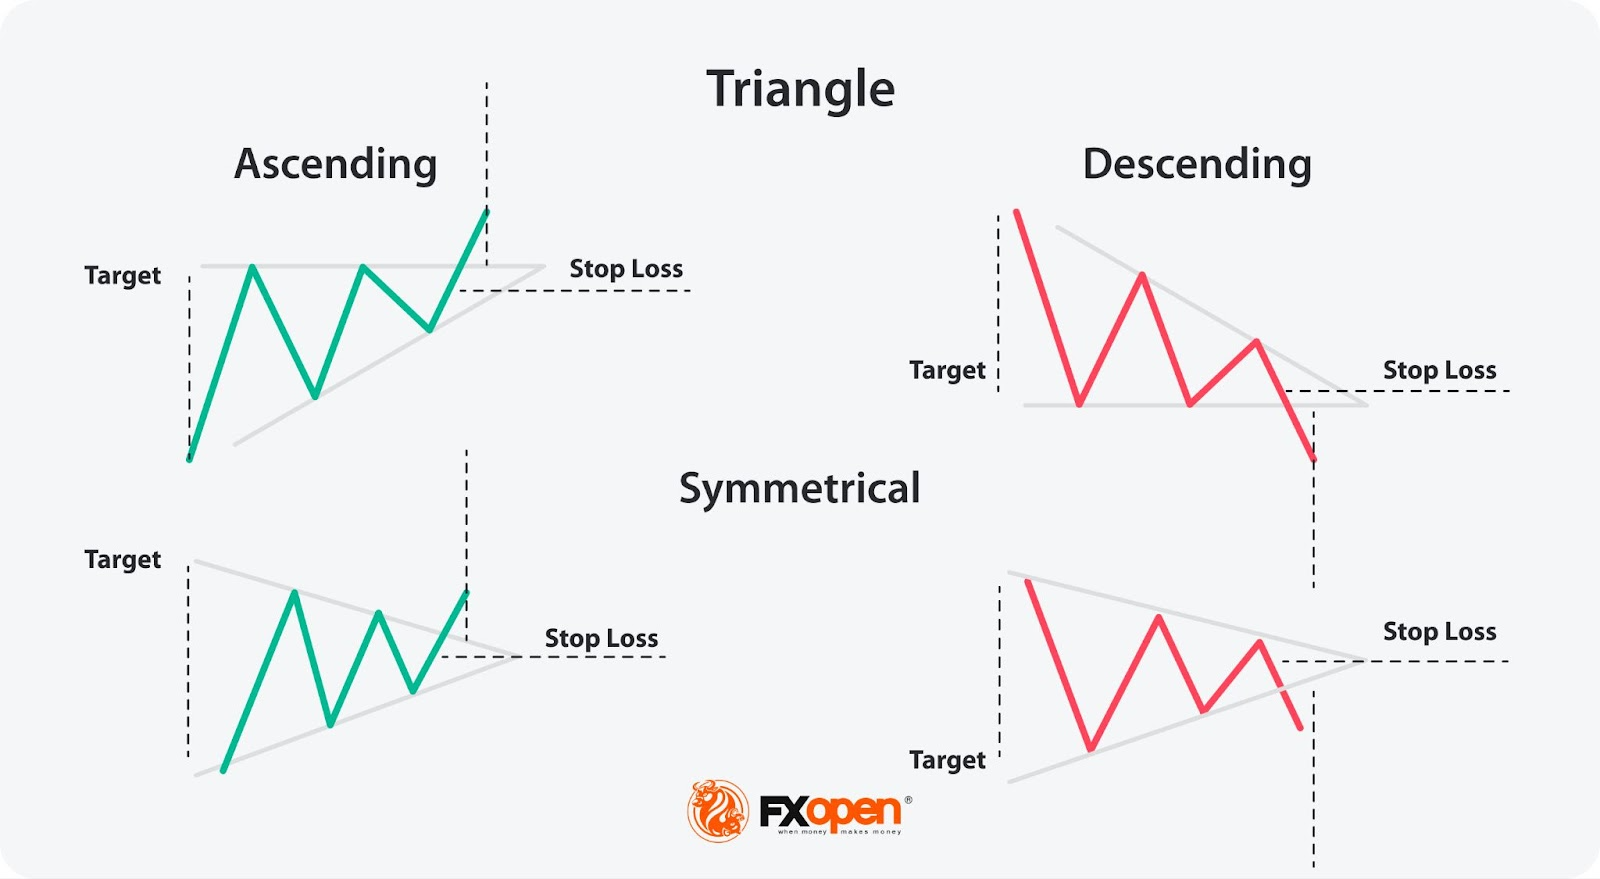
The ascending triangle is a bullish formation and the descending triangle is bearish. At the same time, the symmetrical triangle is a bilateral setup that signals a rise and a fall in the price.
To distinguish between them, traders draw trendlines. In a rising triangle pattern, an upper trendline is horizontal and connects equal or almost equal highs, while the lower trendline is rising as it connects higher lows. In a descending or falling triangle pattern, the lower trendline is horizontal and connects equal or almost equal lows, while the upper trendline declines, going through lower highs. A symmetrical triangle has a falling upper line that connects lower highs and a rising lower line that connects upper lows.
How Traders Spot the Ascending Triangle
There are a few rules that may help a trader determine its strength.
- The trend strength. Although the setup may appear on any timeframe, traders look for strong long-term trends as risks of a fakeout on low charts are higher.
- Consolidation. Triangles appear when the market consolidates within an overall trend.
- Trendlines. Trendlines must be drawn through at least two points. Still, the larger the number of points, the higher the possibility the setup works.
- Breakout. Can the ascending triangle pattern be bearish? No. It is a bullish formation that appears in a bullish and a bearish trend but always signals a potential price rise.
How Might You Trade Ascending Triangles?
The rising triangle pattern is usually considered a continuation setup formed in an uptrend. Still, if the ascending triangle is in a downtrend, it may signal a trend reversal. The trading rules will be the same in both cases.
As with most chart patterns, triangles have specific rules that traders may use to place entry and exit points.
Entry
The theory suggests trades go long when the price breaks above the setup's upper boundary. In a conservative approach, traders wait for the price to form at least several candles before entering the market. In a risky strategy, traders open a position as soon as the breakout occurs, and the breakout candlestick closes.
It's worth considering trading volumes as breakouts often turn into fakeouts, meaning the market returns to its previous trend. The chance of a strong breakout is higher if the volumes are high.
However, increased volumes aren't the only tool used to confirm a breakout. Many traders consider trend indicators and oscillators to potentially limit the risks of bad trading decisions.
- If the triangle serves as a continuation setup, it may be helpful to look at the signals of trend-strength indicators, including the average directional index.
- If traders use the ascending triangle as a reversal setup, they usually implement indicators that may signal a trend reversal, including the moving average, the relative strength index, the moving average convergence divergence, and the stochastic oscillator.
Take Profit
A standard take-profit target equals the size of the largest part of the setup and is measured just from the breakout trendline.
Stop Loss
Traders consider several options when placing stop-loss levels. In a conservative approach, they implement the risk/reward ratio, which is usually 1:2 or 1:3 but depends on the trader's willingness to take risks. Also, traders utilise the upper trendline as a threshold and place the stop-loss order just under it.
Note: These are general rules. However, traders can develop their own trading strategies and adjust the pattern's settings and rules according to their trading approach. You may try the FXOpen TickTrader platform to practise identifying triangles on live charts.
Ascending Triangle Trading Example
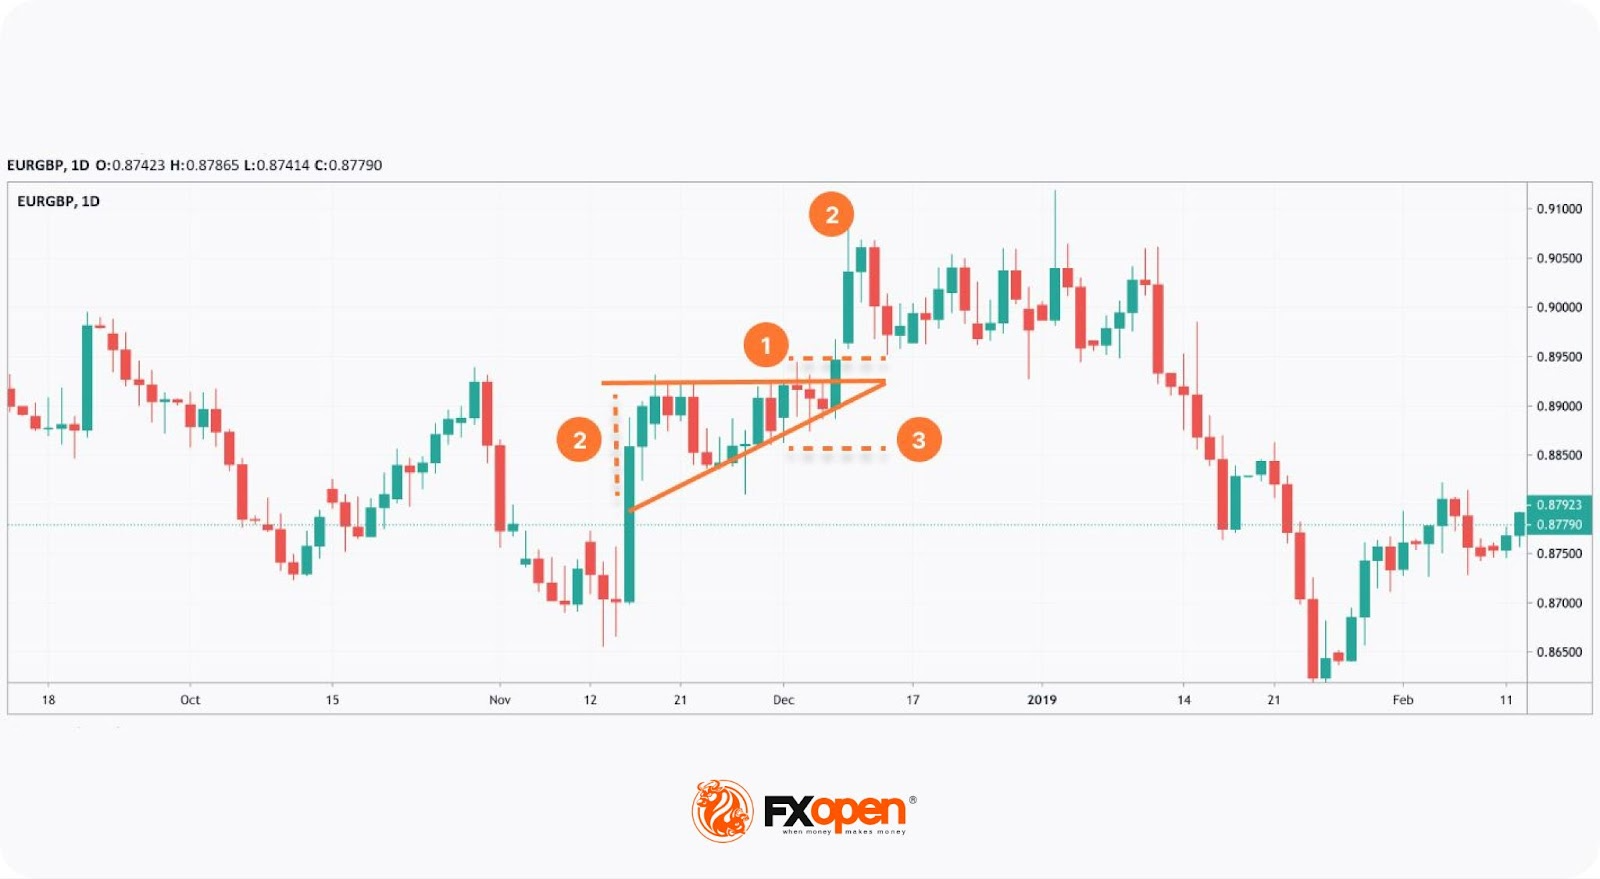
A bullish ascending triangle pattern formed on the daily chart of the EUR/GBP pair. The price skyrocketed, and as a result, the rising triangle formed, allowing bulls to take a break. As the trend wasn’t solid, a trader could go long as soon as the breakout candle closed (1). Otherwise, the trade would fail. A take-profit target would equal the size of the triangle’s widest part (2) and be measured just from the upper trendline. A stop-loss level of 1:2 or 1:3 risk/reward ratio would work (3).
Ascending Triangle Strategy
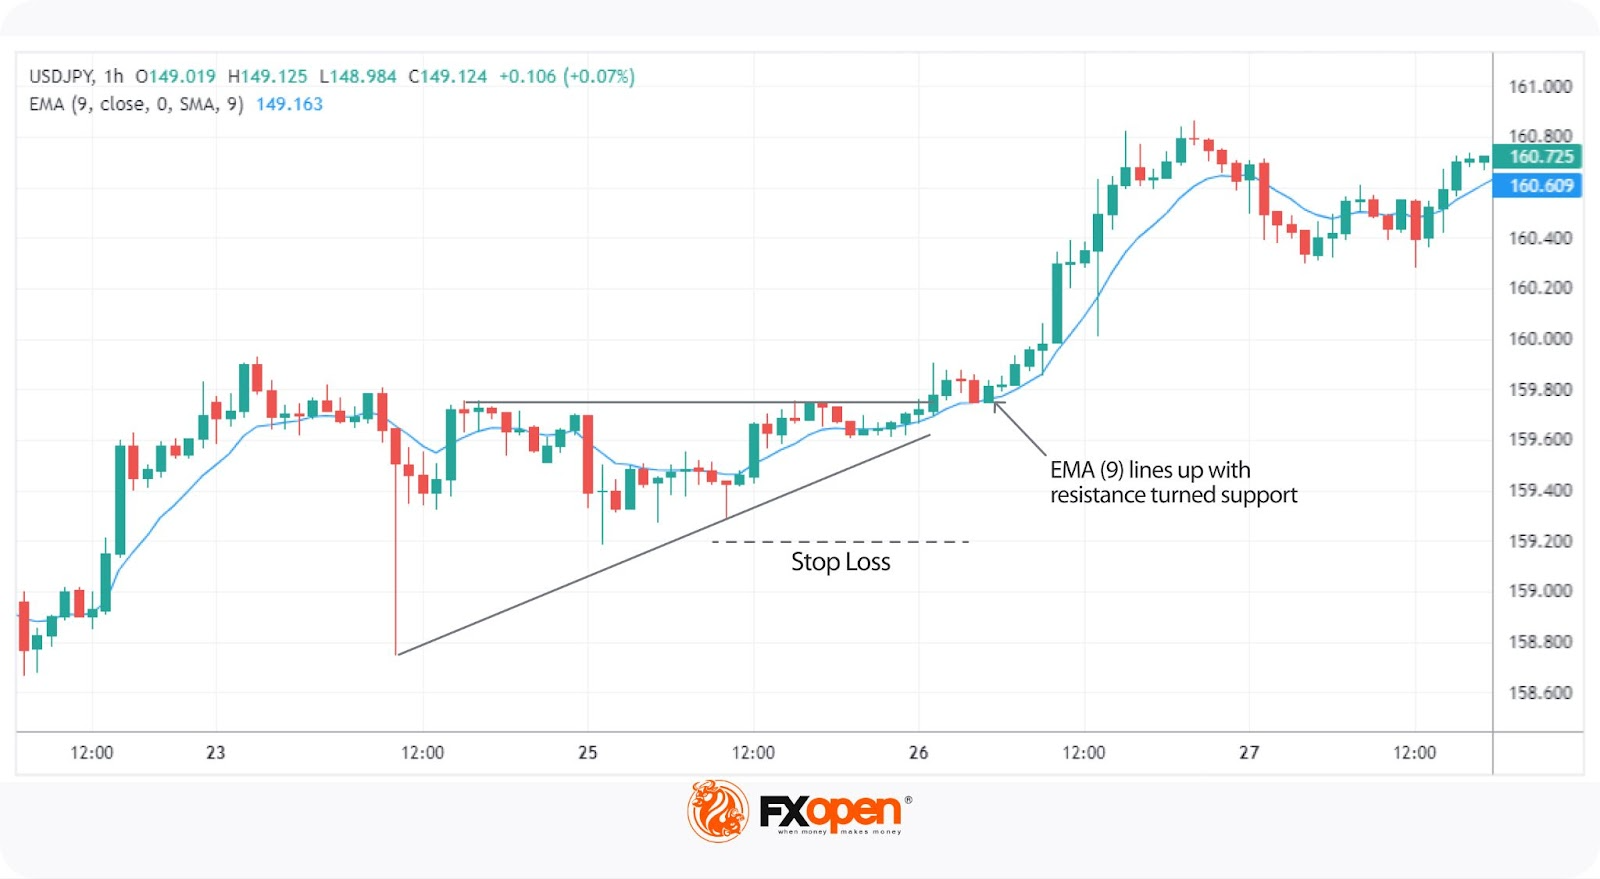
In this strategy, traders observe an existing bullish trend and the formation of an ascending triangle, which suggests the potential for a continuation pattern. Incorporating a short-term moving average, such as a 9-period EMA, provides dynamic support, aligning with the trendline to strengthen the setup.
Entries
- Traders typically wait for the price to break through the top trendline of the ascending triangle.
- A strong candle breaking the resistance level adds confidence, though any move above the top trendline can serve as an entry signal.
- The price should also trade above the moving average, offering additional confirmation.
- An order is often placed at the top trendline, anticipating a retracement to this level, which now acts as support.
Stop Loss
- Traders place a stop-loss below the most recent swing low within the triangle.
- For more conservative traders, the stop may be set at any prior swing low, depending on risk tolerance.
Take Profit
- Many traders aim for a risk-reward ratio of 1:2 or 1:3.
- Profits might also be taken at the next strong resistance level, aligning with the market structure.
Rising Triangle: Benefits and Drawbacks
This formation has advantages and pitfalls that traders consider when developing their strategies.
Benefits
- It can be used on any timeframe. Triangles are formed on charts of any period. Still, they might be more effective if the setup appears in a solid trend on a high timeframe.
- It can be used for any asset. Another advantage is that the ascending triangle pattern is used for stock, commodity, cryptocurrency*, and Forex trading.
- Straightforward. A trader only needs to draw two trendlines to define this setup on the chart.
- Exact entry and exit points. Although traders can develop their entry and exit points, the setup assumes there are specific rules traders with any experience utilise.
Drawbacks
- It can confuse traders. As the rising triangle is used as a reversal and continuation formation, traders with less experience may be confused with its signals.
- False breakouts. The setup works when a price breakout occurs. However, there is a high risk the breakout will appear to be a fakeout, and the price will return.
- The pattern may fail. Aside from a fakeout, there is another risk when trading with triangles. The price may break another side of the formation, and the formation will fail.
- The trading rules may not work. Although specific rules indicate where a trader should place entry and exit points, buyers may be too weak to push the price to the take-profit target.
Final Thoughts
The ascending triangle is one of the more common chart patterns traders use when trading various assets. Still, there is no guarantee that it will work every time you spot it on a price chart. It's vital to remember that every signal must be confirmed with other indicators, chart patterns, or candlesticks. Also, it's a well-known fact that any trade involves risks that should be considered every time a trader enters the market. Improve your skills by practising on different assets and timeframes.
You may consider opening an FXOpen account today to get access to over 700 markets and enjoy trading with tight spreads and low commissions. Good luck!
FAQ
How Is an Ascending Triangle Formed?
An ascending triangle is formed when the price action creates a series of higher lows while facing a resistance level, resulting in a horizontal upper trendline and a rising lower trendline. The price consolidates between these two lines before potentially breaking out above the resistance, signalling a bullish continuation.
Is an Ascending Triangle Bullish or Bearish?
The ascending triangle is a bullish pattern. It suggests that buyers are gaining strength as higher lows form, increasing the likelihood of a breakout above the resistance level. There is a descending triangle pattern that usually appears in a downtrend, signalling a downward movement.
How May Traders Enter a Trade with an Ascending Triangle?
According to the theory, in triangle pattern trading, it’s common to enter the market when the price breaks above the upper trendline of the triangle. In a conservative approach, traders wait for confirmation through several closing candles after the breakout. The increased volume also adds confidence to the trade.
What Is the Ascending Triangle Pattern Retest?
A retest occurs when the price breaks out of the triangle but then briefly falls back to test the former resistance level. A successful retest confirms the breakout and can provide an additional entry point.
How Long Does an Ascending Triangle Pattern Take to Form?
The formation of a bullish triangle pattern can vary based on the timeframe. On daily charts, it can take several days to weeks, while on shorter timeframes, it might form within hours.
What Is the Difference Between an Ascending Triangle and a Rising Wedge?
In comparing the ascending triangle vs. the rising wedge, it’s important to recognise that the rising wedge has converging trendlines, signalling a possible weakening trend, often leading to a bearish reversal. In contrast, an ascending triangle trading pattern typically signals a continuation of the uptrend.
*Important: At FXOpen UK, Cryptocurrency trading via CFDs is only available to our Professional clients. They are not available for trading by Retail clients. To find out more information about how this may affect you, please get in touch with our team.
This article represents the opinion of the Companies operating under the FXOpen brand only. It is not to be construed as an offer, solicitation, or recommendation with respect to products and services provided by the Companies operating under the FXOpen brand, nor is it to be considered financial advice.
Stay ahead of the market!
Subscribe now to our mailing list and receive the latest market news and insights delivered directly to your inbox.


Latest articles

GBP/CHF: Trendline or RSI — Which One Is Lying?
Sterling enters this week on firmer footing, with political uncertainty fading fast after Andy Burnham's confirmation as Labour leader eased investor concerns over the succession to Keir Starmer. Markets reacted further to reports pointing to Shabana Mahmood as the frontrunner

Silver Attempts to Break Out of Its Range
Silver continues to balance between its dual role as an industrial metal and so-called refuge asset, and this combination largely explains the lack of a clear trend in recent weeks. Shifting expectations for central bank interest rates can influence the

Nasdaq 100: Is This the Correction Traders Have Been Waiting For?
The Nasdaq 100 (US Tech 100 Mini on FXOpen) remains caught between two opposing forces: cooling inflation on one side, and persistent geopolitical instability on the other. On 14 July, June's CPI print came in softer than expected, easing near-term