


EOS/USD and LTC/USD struggling to keep up the upward momentum
FXOpen

EOS/USD
From last Monday the price of EOS has been in an upward trajectory and has recovered by around 19%, coming from $6 at the open to $7.211 on Tuesday 18th. Since the price reached its weekly high it started decreasing again and has fallen by 8% on the next day coming to $6.67 but is currently trading slightly above at around $6.774.
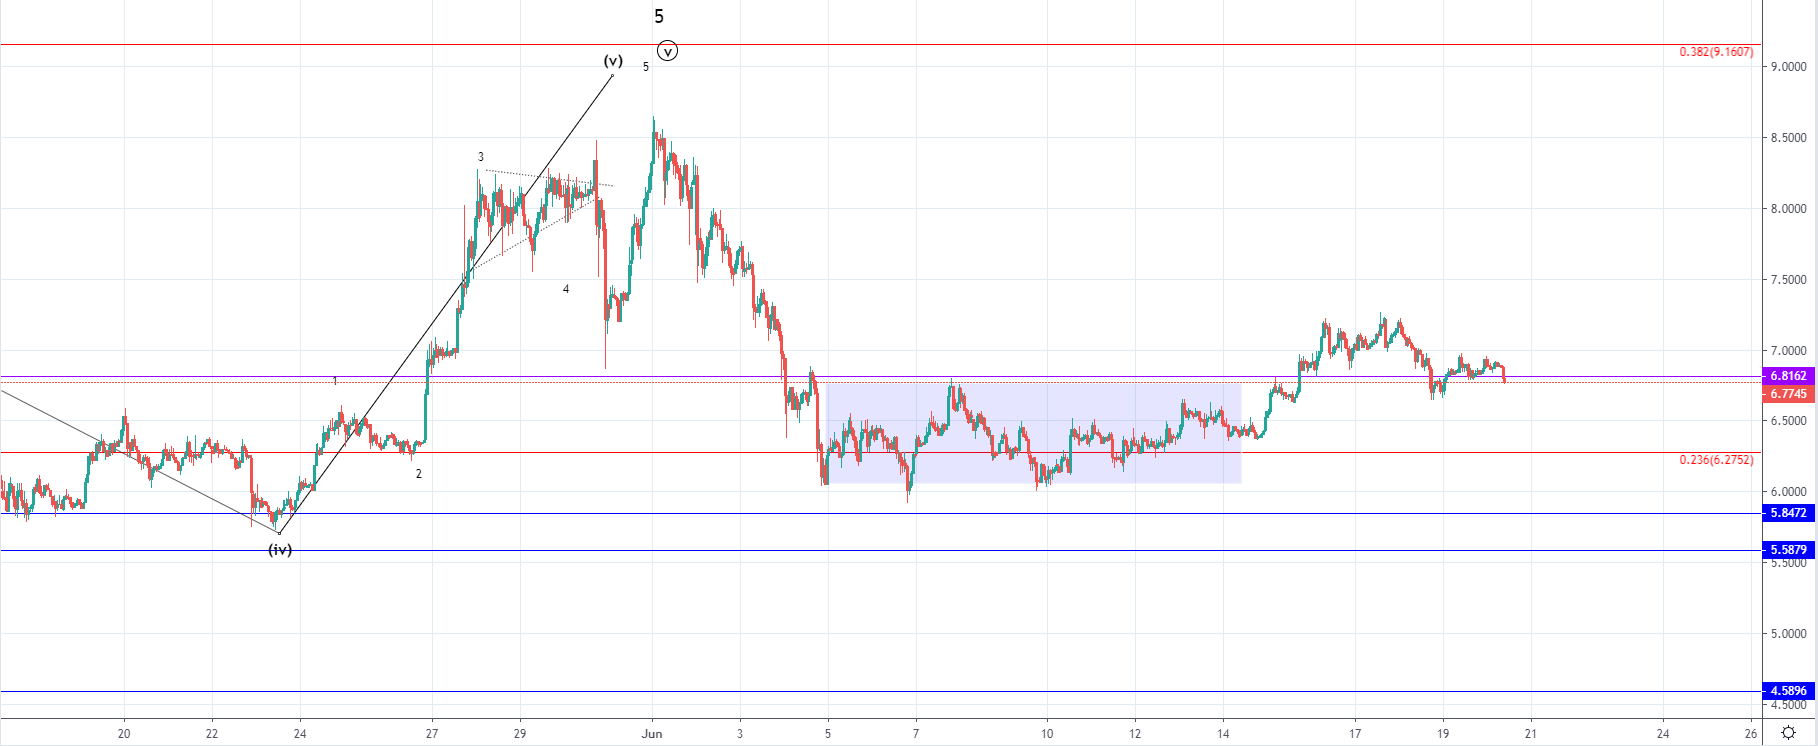
On the hourly chart, you can see that the price of EOS attempted to break out to the upside on three occasions but the resistance found at $7.211 was stronger than the upward momentum which is why a rejection those levels brought the price down to the first significant horizontal support level at $6.81 around which the price is currently hovering. As this retest of support is currently in play we could see further downfall especially considering that the price failed to keep up the bullish momentum past the minor resistance point.
If the support is however found at the present levels another increase with a higher high would occur but I wouldn’t expect to see a significant rise as the price is likely in a corrective stage after an impulsive downfall of 29.42% was made till 5th of June.
This would shortly be verified by the current support interaction but at the momentum, it looks more likely that further downfall should be expected below the 0.236 Fibonacci level and on to the first significant support zone from $5.84 to $5.58, but if we have seen an upward correctional movement after an impulsive downfall the next wave to the downside would be even stronger which is why we could see the price going below $5.
LTC/USD
From yesterday’s open at $132.687 the price of Litecoin has increased by 5.19% as it came up to $139.584 at its highest point on today’s open, but since the price came up to those levels a decreased of 3.49% was made with the price currently being traded at $135.44.
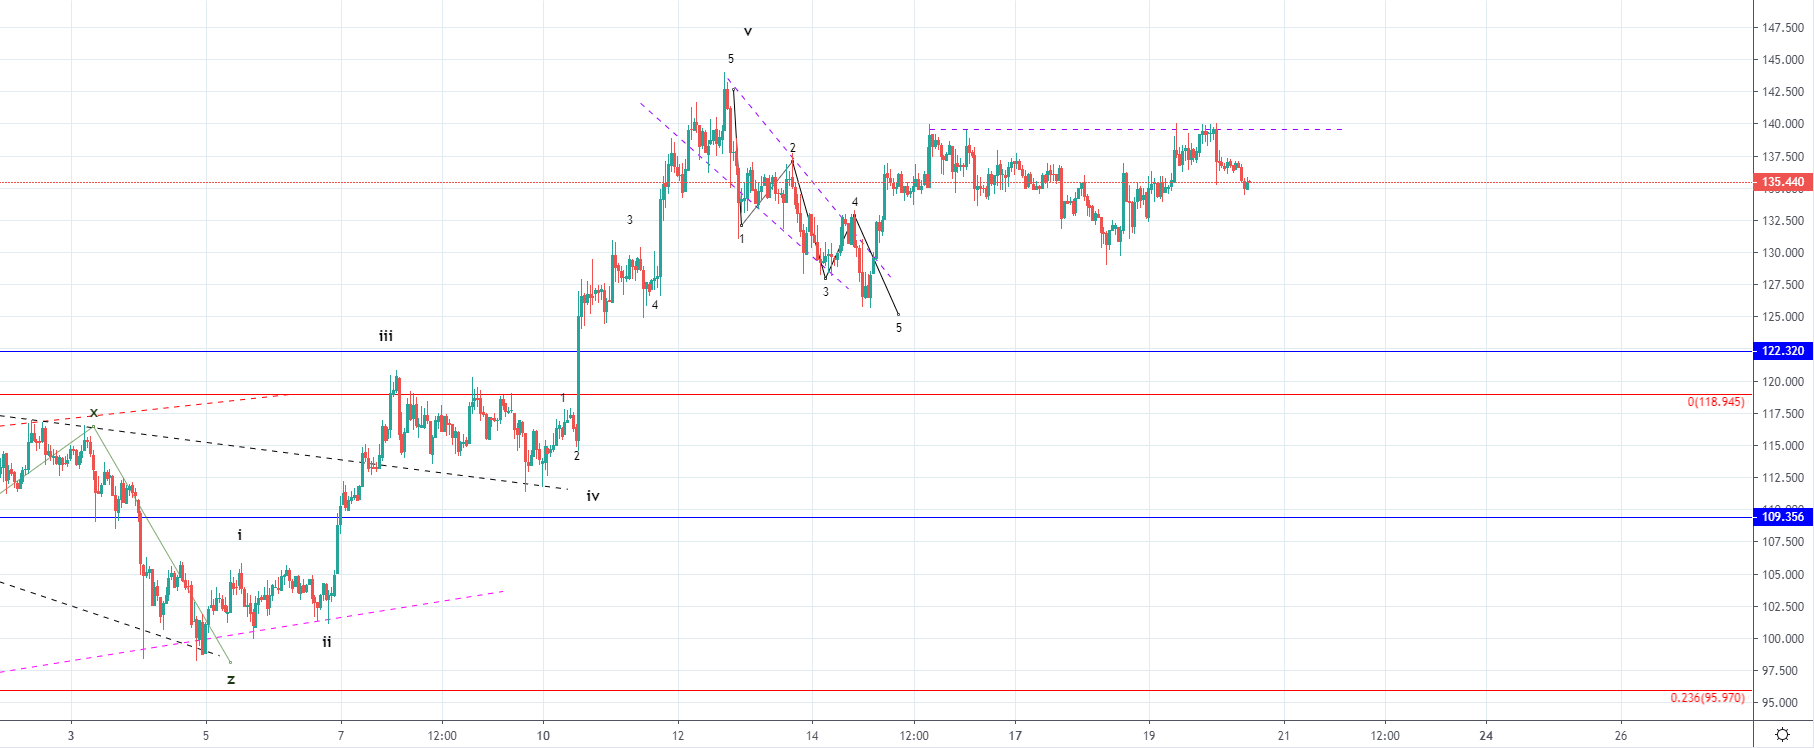
The price came up to the significant horizontal resistance point with whom an interaction has been made on Saturday ending as a rejection, causing the price to move to the downside below $134 which is a minor support point. As another attempt for a breakout above the minor resistance level ended as another rejection the price started moving to the downside again but has maintained holding above $134 for now.
Previous to this sideways movement we have seen the completion of the five-wave impulse to the upside after which a descending five-wave triangle has developed. This could indicate that the currently seen sideways movement is the second correctional structure from the starting downtrend with the price being stopped out on two occasions below the prior high. If the price starts decreasing further from here and goes below $134 again further downside could be expected to the first significant horizontal level at around $120 area where the horizontal level is forming a zone with the 0 Fib level. But if the price doesn’t find support there and enters the lower range we could see significant depreciation in value for this cryptocurrency.
FXOpen offers the world's most popular cryptocurrency CFDs*, including Bitcoin and Ethereum. Floating spreads, 1:2 leverage — at your service (additional fees may apply). Open your trading account now or learn more about crypto CFD trading with FXOpen.
*Important: At FXOpen UK, Cryptocurrency trading via CFDs is only available to our Professional clients. They are not available for trading by Retail clients. To find out more information about how this may affect you, please get in touch with our team.
This article represents the opinion of the Companies operating under the FXOpen brand only. It is not to be construed as an offer, solicitation, or recommendation with respect to products and services provided by the Companies operating under the FXOpen brand, nor is it to be considered financial advice.
Stay ahead of the market!
Subscribe now to our mailing list and receive the latest market news and insights delivered directly to your inbox.


Latest articles

DAX 40: consolidation amid technology sell-off
A wave of selling in the technology sector that emerged earlier this week has weighed on European equities. The trigger was investor concern over the profitability of large-scale debt-funded investments by major US tech companies in AI infrastructure. The Nasdaq

Euro Hits Fresh Yearly Lows Amid Dovish ECB Signals
The euro remains under pressure following weak macroeconomic data from the euro area and fresh signals that the European Central Bank is prepared to maintain a more accommodative monetary policy stance. Data released yesterday pointed to a deterioration in business

Pound at Key Levels: Markets Assess Impact of Political Uncertainty in the UK
The British pound remains under pressure following increased political uncertainty in the United Kingdom triggered by the Prime Minister’s resignation. Investors are assessing potential shifts in the political and economic policy outlook after the head of government stepped down,