


ETH/BTC Crumbles, Dash Continues Downtrend
FXOpen

The panic flight to bitcoin continues and market players are dumping everything to buy up some coins. Dash continued the downtrend started last week and ETH/BTC crumbled after a key support level was broken.
ETH/BTC Crumbles as Support Breaks
The key support level at 0.06626 BTC fell on Monday and led to a quick drop to 0.05845. In percentage terms, this was a loss of close to 12% in less than 20 hours. In the next few days prices recovered somewhat but today the decline resumed and we hit new lows at 0.05814 BTC. We are currently trading just slightly off the lows at 0.05834 per BTC.

As we wrote last week, 0.06626 was key support. A new downtrend has now commenced in ETH/BTC. To end it, the bulls will have to break above the 0.07136 swing high. Higher up a breakout above the next important swing high at 0.07750 is needed for a new uptrend.
Below current prices support can be found at the 0.05 round figure and the 0.04405 swing low, followed by another round level at 0.04 and the 2016 high at 0.03720 BTC. Further down we find a strong support area consisting of the 0.03409 swing high and the 0.03383 swing lows. A clearing of this area could lead to accelerated losses in ETH/BTC. On the longer-term charts, the situation hasn’t changed much. The weekly chart is range-bound while the monthly is still in rally mode.
Dash Downtrend Continues
The downtrend in DSH/BTC continues. We are currently trading at 0.5588 per BTC, down from 0.07045 last week. The losses amount to over 20% since last Thursday.
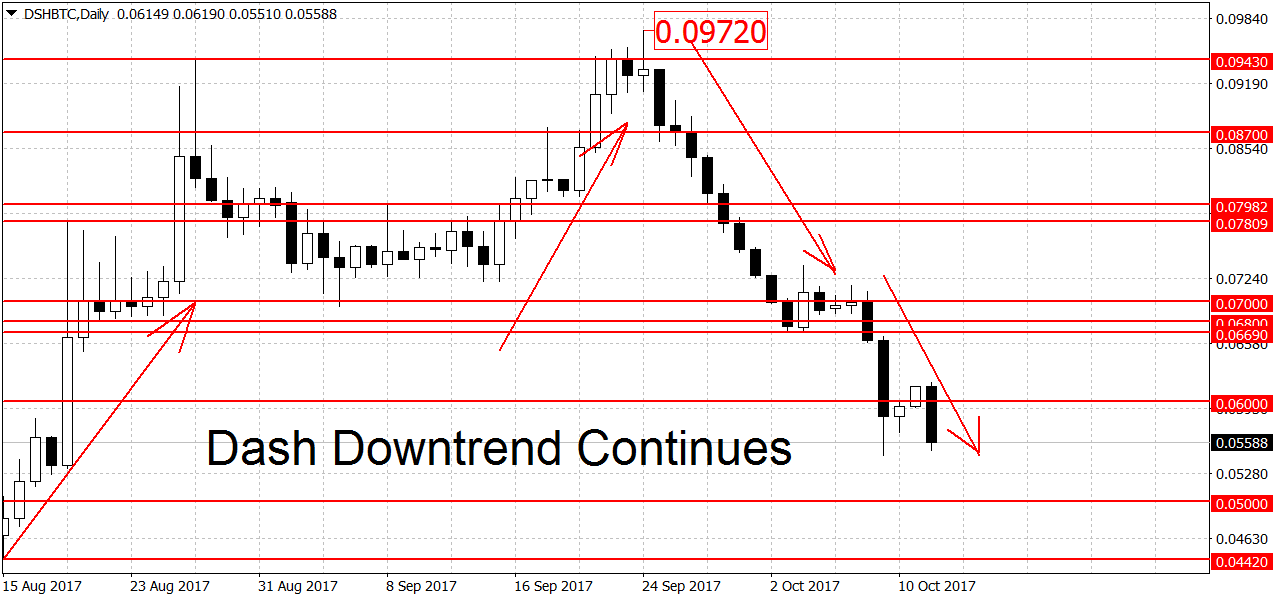
Weak support can be found at this week’s low of 0.05462 BTC, followed by the 0.05 round figure. Further down we have a large but very strong support area consisting of three previous swing lows at 0.04177, 0.04303 and 0.04420 BTC. A clearing of this area should open the way for large losses in Dash.
On the upper end, we have resistance at the previous support area starting from 0.06690 to 0.07 BTC. But the downtrend will remain in place until the 0.07367 swing high is taken out as well. A new rally in prices requires a move above last month’s highs at 0.09720 BTC. Despite the downtrend on the dailies, on the weekly and monthly charts, DSH/BTC is still in an uptrend.
If you are looking for a cryptocurrency trading platform, try Crypto accounts with FXOpen.
FXOpen offers the world's most popular cryptocurrency CFDs*, including Bitcoin and Ethereum. Floating spreads, 1:2 leverage — at your service (additional fees may apply). Open your trading account now or learn more about crypto CFD trading with FXOpen.
*Important: At FXOpen UK, Cryptocurrency trading via CFDs is only available to our Professional clients. They are not available for trading by Retail clients. To find out more information about how this may affect you, please get in touch with our team.
This article represents the opinion of the Companies operating under the FXOpen brand only. It is not to be construed as an offer, solicitation, or recommendation with respect to products and services provided by the Companies operating under the FXOpen brand, nor is it to be considered financial advice.
Stay ahead of the market!
Subscribe now to our mailing list and receive the latest market news and insights delivered directly to your inbox.


Latest articles

EUR/USD Eyes Gains As USD/CHF Weakness Deepens Again
EUR/USD started a fresh increase above 1.1700 and 1.1720. USD/CHF declined further and is now struggling below 0.7835.
Important Takeaways for EUR/USD and USD/CHF Analysis Today
· The Euro started a decent increase from

Apple: Earnings Day Above the Activity Zone
On 30 April, after the market close, Apple Inc. will release its financial results for the second quarter of fiscal 2026. The consensus forecast, based on estimates from 31 analysts, points to revenue of around $109.7 billion, with expected

USD/JPY and USD/CHF Near Key Levels: The Dollar Supported by the Fed
The US dollar continues to trend upwards following the Federal Reserve meeting, drawing support from the regulator’s moderately hawkish stance and comments by Jerome Powell. Markets interpret the Fed’s rhetoric as a signal that restrictive policy is likely