


Ether Hits All-Time High
FXOpen

Ether managed to enter another rally last week. Today prices hit an all-time high, surging over 0.062 BTC per coin. Dash, on the other hand, failed its breakout last week and has been trading flat ever since.
Ether Hits All-Time High
Ether prices broke above the 0.05 resistance last week. The breakout initially was a bit weak, with prices retesting the previous resistance two times (see chart below). But after this ETH/BTC decidedly broke higher and just hit an all-time high of 0.06247 during the past few hours.
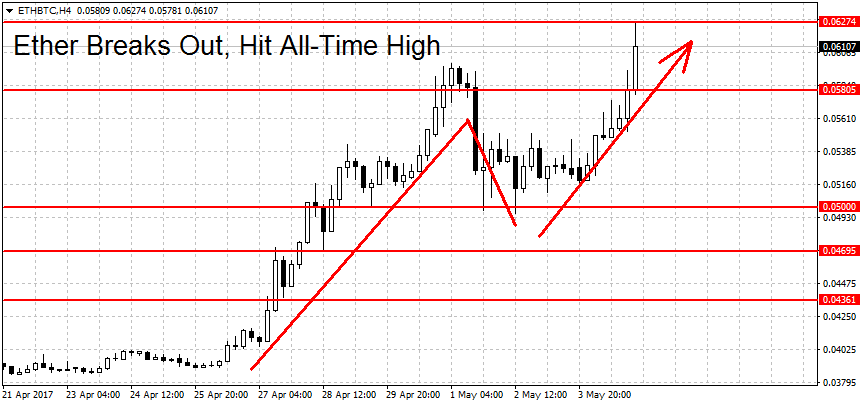
The trend is now up and more gains could be coming. Being near all-time highs there are no previous levels above to count as resistance. Only the round figures at 0.065, 0.070, 0.075, 0.08 etc remain as possible levels. On the lower end, we have potential support at the previous resistance (now turned support) of 0.05. But while a break below this figure would be cause for worry, the rally will remain intact until prices fall below the 0.039 swing low. The long-term charts (weekly and monthly) are showing the same bullish picture as the daily.
Fundamentally one of the drivers behind the recent gains seems to be the recently ended Ethereum Enterprise Alliance meeting. At the event hosted in New York, there were representatives from JP Morgan, BNY Mellon, ConsensSys, Monax, BlockApps and others. Ethereum has been known to rally around these type of events in the past.
Dash Breakout Fails
Dash prices didn’t manage to stage a successful breakout last week. Dash traded as high as 0.07746 on April 29th. While this managed to end the previous downtrend, the break had no follow-through and soon DSH/BTC erased all of the gains from that day. This can be seen on the chart below as a reverse V-shaped price formation.
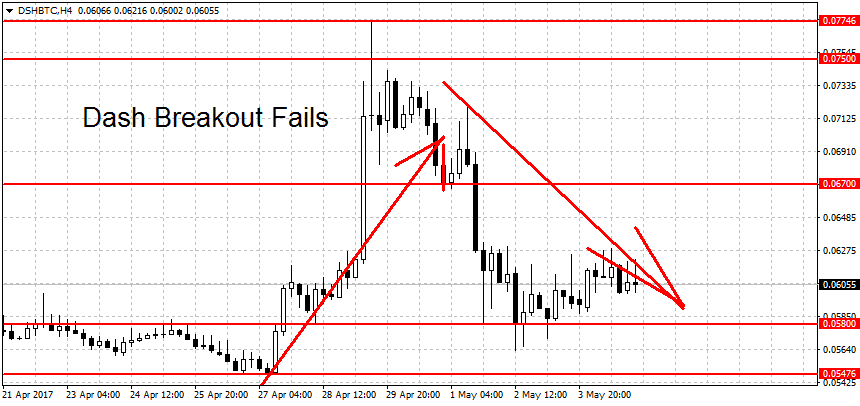
What’s next for Dash? A new rally now requires a breakout above 0.07746 BTC. On the lower end, a downtrend needs a move below 0.05476. Support can be found at the 0.05 BTC round figure, followed by a stronger level at the 0.04825 swing high and 0.04177, last month’s low for DSH/BTC. We have more support bellow here at 0.315, 0.02879 and 0.02478 BTC. The breakout point for the previous rally at 0.0175 now acts as a support to falling prices.
Until either 0.07746 BTC or 0.05476 is broken, Dash will remain range-bound on the short-term charts. The longer-term charts (weekly and monthly) are still bullish, however.
Start trading cryptocurrency with FXOpen broker.
FXOpen offers the world's most popular cryptocurrency CFDs*, including Bitcoin and Ethereum. Floating spreads, 1:2 leverage — at your service (additional fees may apply). Open your trading account now or learn more about crypto CFD trading with FXOpen.
*Important: At FXOpen UK, Cryptocurrency trading via CFDs is only available to our Professional clients. They are not available for trading by Retail clients. To find out more information about how this may affect you, please get in touch with our team.
This article represents the opinion of the Companies operating under the FXOpen brand only. It is not to be construed as an offer, solicitation, or recommendation with respect to products and services provided by the Companies operating under the FXOpen brand, nor is it to be considered financial advice.
Stay ahead of the market!
Subscribe now to our mailing list and receive the latest market news and insights delivered directly to your inbox.


Latest articles

Weekly Market Insights with Gary Thomson: The Week of Central Banks and Earnings
In this video, we’ll explore the key economic events and market trends, shaping the financial landscape. Get ready for insights into financial markets to help you navigate the week ahead. Let’s dive in!
In this episode of Market

Intel at a Crossroads: Earnings Beat Meets Technical Resistance
Intel has just delivered its strongest quarter in over fifteen years, and the market reaction says it all. Q2 2026 revenue surged 25% year-over-year to $16.1 billion, crushing the consensus estimate of $14.42 billion, while adjusted EPS of

Tesla: Complex Range Structure Breaks Down Following Quarterly Earnings
Tesla released its Q2 2026 results after the market closed on 22 July. Revenue increased 26% year-on-year to $28.24 billion, while vehicle deliveries reached a record 480,126 units. However, operating margin fell sharply to 1.4%, down from