


Ether in Downtrend After Major Losses
FXOpen

It’s been tough two weeks for Ether. Since our last update, the fledgling crypto-currency lost over 26 percent versus bitcoin and even more versus the US Dollar.
Ether in Downtrend After Losses
After the recent large losses, ETH/BTC is now in a downtrend. The altcoin lost close to 30 percent versus the US Dollar and 26 percent versus bitcoin.
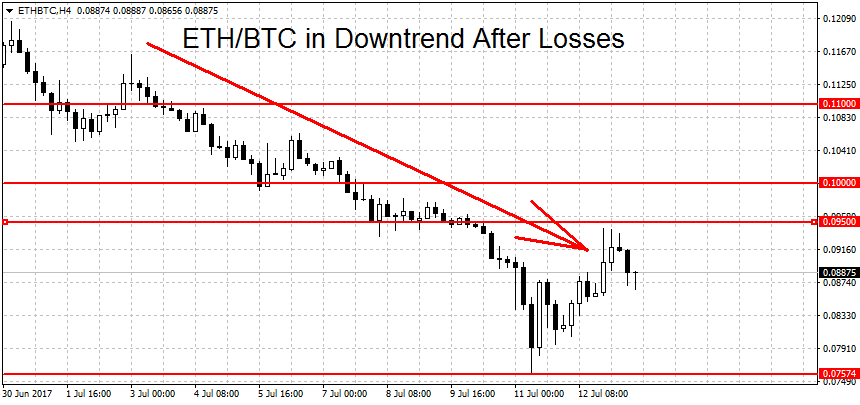
Support on the way down can be found at this month’s low of 0.07574, followed by the 0.0631 swing low and the 0.05 round figure. On the way up we have resistance at the 0.10 round figure. A clean breakout above 0.11 BTC would end the current downtrend. A move above the 0.1259 swing high is needed for a new rally. On the long-term charts (weekly and monthly) ETH/BTC remains in a bullish trend.
Fundamentally no major news transpired during the past few weeks. It’s possible that the flurry of ICOs during June is now leading to selling pressure. Two major ICOs, Status and Tezos, stated that they plan to sell the acquired Ether, albeit at a gradual pace.
Another Unsuccessful Breakout in Dash
Dash Prices are back in a range after yet another unsuccessful breakout, the third one in a row. On July 6th DASH/BTC peaked to a high of 0.08697. Three days later a low of 0.06674 was hit. We are currently quoted somewhat in the middle at 0.07285 BTC per coin.
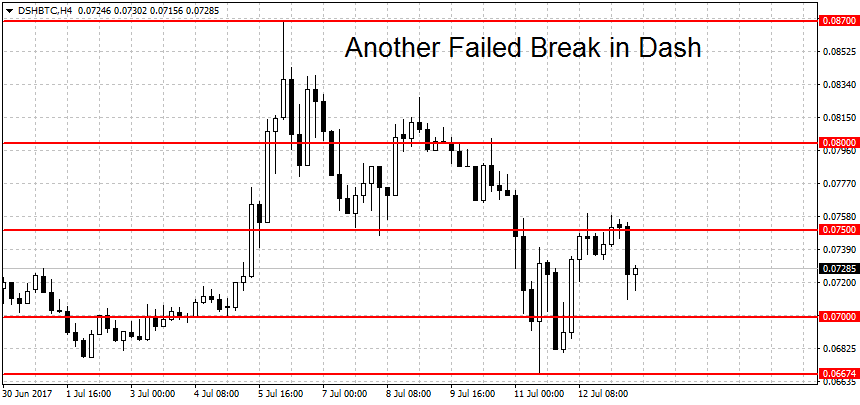
A new rally requires a decisive breakout above the high at 0.087 BTC. Yes, we already had 3 failed attempts to go higher. But with each failed test we get closer to a potential trend starter. For us, it doesn’t matter which way the market moves. A break below the 0.0606 swing low would start a new downtrend while a move above 0.08748 could start an uptrend. In either case, following the market should pay off over the long-haul. On the long-term charts, Dash/BTC is looking bullish as well.
Bitcoin Remains in a Range
A crypto update is not complete without mentioned big brother. Bitcoin is still stuck in a range on the daily charts. The two levels to watch are $2,245 on the downside and $2,700 on the upside. A clean break above either of these price extremes could start a new trend lower/higher. On the long-term charts, BTC/USD is in rally mode, just like ETH/BTC and Dash/BTC.
You can always trade cryptocurrencies with FXOpen broker.
FXOpen offers the world's most popular cryptocurrency CFDs*, including Bitcoin and Ethereum. Floating spreads, 1:2 leverage — at your service (additional fees may apply). Open your trading account now or learn more about crypto CFD trading with FXOpen.
*Important: At FXOpen UK, Cryptocurrency trading via CFDs is only available to our Professional clients. They are not available for trading by Retail clients. To find out more information about how this may affect you, please get in touch with our team.
This article represents the opinion of the Companies operating under the FXOpen brand only. It is not to be construed as an offer, solicitation, or recommendation with respect to products and services provided by the Companies operating under the FXOpen brand, nor is it to be considered financial advice.
Stay ahead of the market!
Subscribe now to our mailing list and receive the latest market news and insights delivered directly to your inbox.


Latest articles

EUR/USD Eyes Gains As USD/CHF Weakness Deepens Again
EUR/USD started a fresh increase above 1.1700 and 1.1720. USD/CHF declined further and is now struggling below 0.7835.
Important Takeaways for EUR/USD and USD/CHF Analysis Today
· The Euro started a decent increase from

Apple: Earnings Day Above the Activity Zone
On 30 April, after the market close, Apple Inc. will release its financial results for the second quarter of fiscal 2026. The consensus forecast, based on estimates from 31 analysts, points to revenue of around $109.7 billion, with expected

USD/JPY and USD/CHF Near Key Levels: The Dollar Supported by the Fed
The US dollar continues to trend upwards following the Federal Reserve meeting, drawing support from the regulator’s moderately hawkish stance and comments by Jerome Powell. Markets interpret the Fed’s rhetoric as a signal that restrictive policy is likely