


Ether Little Changed, Dash Down
FXOpen
Both Ether and Dash are trading little changed versus bitcoin. Ether is up by 0.11% while Dash is lower by 0.84 percent since last Thursday. Not large moves by any means and especially not for the crypto market which tends to be more volatile than traditional markets.
Ether Little Changed
Ether is quoted little changed vs BTC. The altcoin had a short and uneventful trip below the 0.07 BTC figure on June 30th only to bounce back quickly. We are quoted at 0.07115 BTC right now, not far from where we were trading at on June 28th.
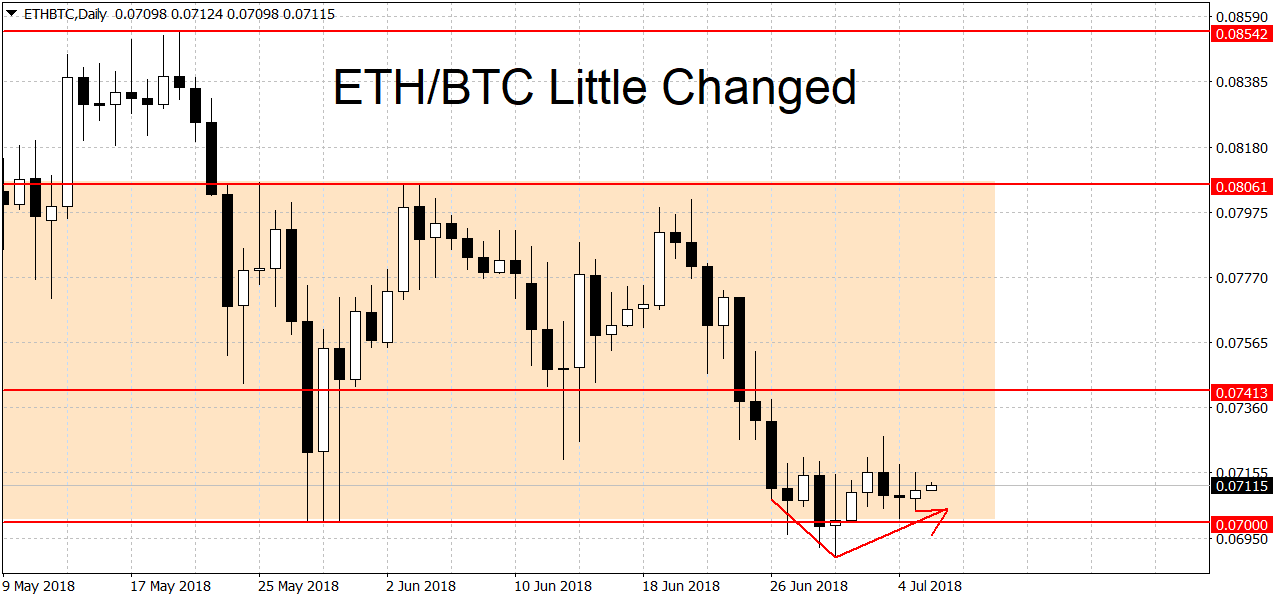
Ether is still in range on the daily charts, we remain in ‘wait and see’ mode here. The shallow break below the previous lows doesn’t count as a trend changer. As we noted in our previous article, we are looking for a decisive break of a level, not just a quick and shallow spike below it. There are a lot of games being played around important levels like 0.07 BTC so you shouldn’t jump the gun too quickly on any break.
The number to beat is now 0.06889 BTC, a decisive break below here should start a new downtrend in prices. Support below here can be found at 0.06606 BTC followed by the former swing high at 0.05906 BTC.
On the upper end, we need to see a break above 0.08061 BTC for a new rally. Higher up there’s resistance at 0.08542 BTC followed by the 0.08829 swing high. Higher still we have the 0.09 and 0.1 BTC round figures as potential resistance levels. A breakout above may open to door to the 2018 high at 0.121 BTC. On the weekly charts, ETH/BTC is range-bound while the monthlies are still holding on to the bullish bias.
More Losses for Dash
The downtrend in DSH/BTC is still in play. The crypto hit new lows yesterday, trading to 0.03526 BTC before bouncing higher. We are currently quoted at 0.03662 BTC per coin.
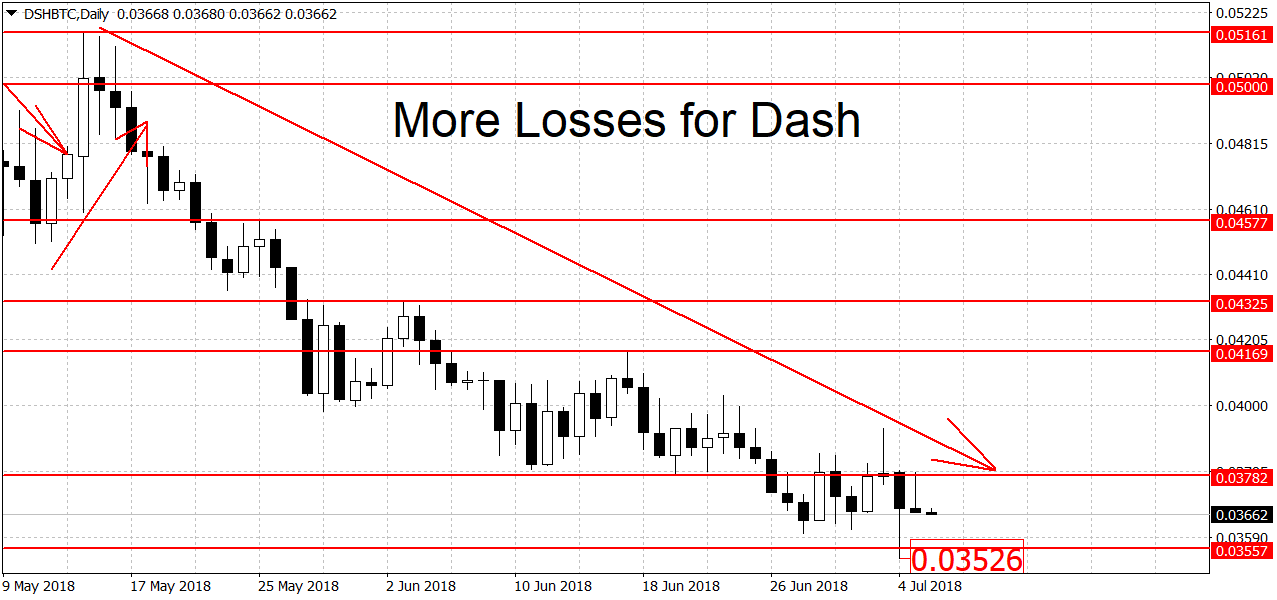
A breakout above 0.03930 BTC is needed to end the bearish trend. However the threshold for a new rally is set a bit higher at 0.04169 BTC.
We have support on the way down at 0.03526 BTC and 0.03452 BTC. The latter level is also a 14-month low for Dash. A breakdown below here could exacerbate the losses. On the longer-term charts, prices are bearish on the weekly charts but bullish on the monthlies.
Try risk-free bitcoin demo trading with FXOpen.
FXOpen offers the world's most popular cryptocurrency CFDs*, including Bitcoin and Ethereum. Floating spreads, 1:2 leverage — at your service (additional fees may apply). Open your trading account now or learn more about crypto CFD trading with FXOpen.
*Important: At FXOpen UK, Cryptocurrency trading via CFDs is only available to our Professional clients. They are not available for trading by Retail clients. To find out more information about how this may affect you, please get in touch with our team.
This article represents the opinion of the Companies operating under the FXOpen brand only. It is not to be construed as an offer, solicitation, or recommendation with respect to products and services provided by the Companies operating under the FXOpen brand, nor is it to be considered financial advice.
Stay ahead of the market!
Subscribe now to our mailing list and receive the latest market news and insights delivered directly to your inbox.


Latest articles

EUR/USD Eyes Gains As USD/CHF Weakness Deepens Again
EUR/USD started a fresh increase above 1.1700 and 1.1720. USD/CHF declined further and is now struggling below 0.7835.
Important Takeaways for EUR/USD and USD/CHF Analysis Today
· The Euro started a decent increase from

Apple: Earnings Day Above the Activity Zone
On 30 April, after the market close, Apple Inc. will release its financial results for the second quarter of fiscal 2026. The consensus forecast, based on estimates from 31 analysts, points to revenue of around $109.7 billion, with expected

USD/JPY and USD/CHF Near Key Levels: The Dollar Supported by the Fed
The US dollar continues to trend upwards following the Federal Reserve meeting, drawing support from the regulator’s moderately hawkish stance and comments by Jerome Powell. Markets interpret the Fed’s rhetoric as a signal that restrictive policy is likely