


Ether Peaks at Over $200 After Breaking All-Time High
FXOpen
There seems to be no stopping the Ether train. Prices peaked at over $200 vs. the US Dollar and 0.1 versus BTC yesterday. Dash, on the other hand, ended its downtrend but gains have proven elusive once more.
Ether Peaks at Over $200 Dollars
Ether prices peaked at over $200 vs the Dollar and over 0.1 versus BTC yesterday. The altcoin is trading a bit weaker against both currencies right now.
But it hasn’t been a smooth journey up to here. Let’s examine how the past two weeks traded in Etherland. The initial breakout above the previous all-time high at 0.06274 BTC triggered a new bull market as expected in our previous ETH article. We topped out at 0.08459 BTC during the initial push on good news from Consensus 2017. A total of 86 members has been added to the Ether Enterprise Alliance.
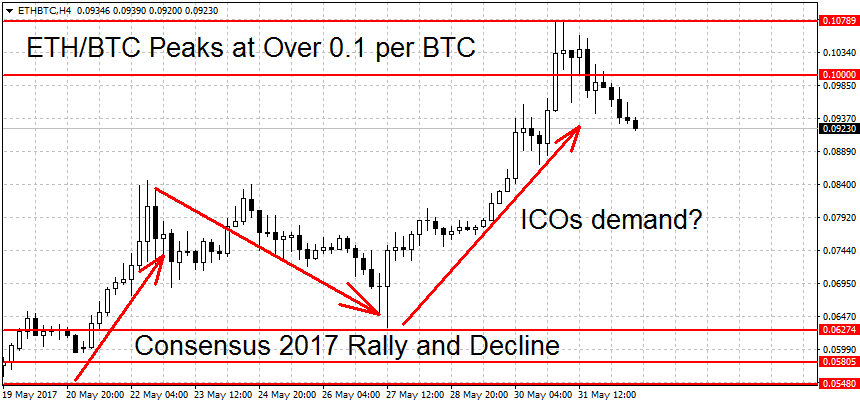
After the Consensus conference ended we got a major crash in ETH/USD and a smaller decline in ETH/BTC. From a high of $209.69 on May 25th prices fell to a low of only $107.78 on May 27th. In ETH/BTC, which is the pair we normally follow in our Thursday article, priced dipped to a low of 0.0631 BTC. This is just above the previous all-time high at 0.06274, so the bullish trend remained intact.
Here a major recovery in prices commenced. Part of the reason for the large subsequent rally was the previous big drop but another major part was likely due to people buying ETH so they can participate in ICOs (initial coin offerings). You can read more on what ICOs are HERE. One of the most anticipated ICOs for this year was BAT (Basic Attention Token). They requested initial funding of $35 million and got it in only 30 seconds. Because the issuing was oversubscribed several-fold, that ETH will be refunded and people that bought it may need to convert it back to USD or plug it into another ICO project.
Technically with the break above the 0.06274 all-time high, we are back in rally mode on the daily charts. The bears need to push ETH/BTC below the 0.0631 BTC swing low to end the current upward trend. On the weekly and monthly charts the trend remains bullish.
Dash Back in Neutral After Ending Downtrend
Dash is back into neutral mode after prices broke out above the 0.06049 BTC swing high. A new uptrend requires a break above the 0.06809 BTC swing high while a new downtrend needs a move below last month’s low at 0.04303 BTC per coin.
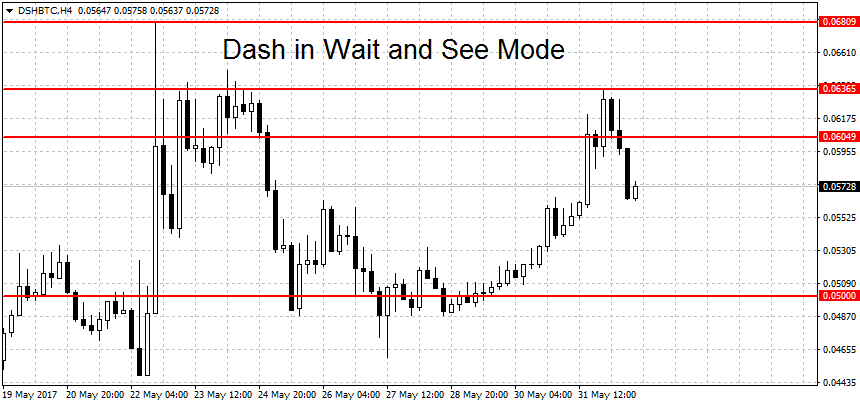
Until either of these levels gives way, we are in ‘wait and see’ mode on the daily charts. On the longer-term charts (weekly and monthly) DSH/BTC is still looking bullish.
Open a cryptocurrency account with FXOpen broker.
FXOpen offers the world's most popular cryptocurrency CFDs*, including Bitcoin and Ethereum. Floating spreads, 1:2 leverage — at your service (additional fees may apply). Open your trading account now or learn more about crypto CFD trading with FXOpen.
*Important: At FXOpen UK, Cryptocurrency trading via CFDs is only available to our Professional clients. They are not available for trading by Retail clients. To find out more information about how this may affect you, please get in touch with our team.
This article represents the opinion of the Companies operating under the FXOpen brand only. It is not to be construed as an offer, solicitation, or recommendation with respect to products and services provided by the Companies operating under the FXOpen brand, nor is it to be considered financial advice.
Stay ahead of the market!
Subscribe now to our mailing list and receive the latest market news and insights delivered directly to your inbox.


Latest articles

Weekly Market Insights with Gary Thomson: The Week of Central Banks and Earnings
In this video, we’ll explore the key economic events and market trends, shaping the financial landscape. Get ready for insights into financial markets to help you navigate the week ahead. Let’s dive in!
In this episode of Market

Intel at a Crossroads: Earnings Beat Meets Technical Resistance
Intel has just delivered its strongest quarter in over fifteen years, and the market reaction says it all. Q2 2026 revenue surged 25% year-over-year to $16.1 billion, crushing the consensus estimate of $14.42 billion, while adjusted EPS of

Tesla: Complex Range Structure Breaks Down Following Quarterly Earnings
Tesla released its Q2 2026 results after the market closed on 22 July. Revenue increased 26% year-on-year to $28.24 billion, while vehicle deliveries reached a record 480,126 units. However, operating margin fell sharply to 1.4%, down from