


FXOpen

It’s a mixed bag this Thursday for Ether and Dash. While Ether is trading a bit higher since our update last week, Dash continues to range.
Ether Bounces From Lows
Ether prices versus bitcoin bounced from the 0.058 lows on FXOpen to 0.081 right now. The lows on other exchanges were around the 0.066 level.
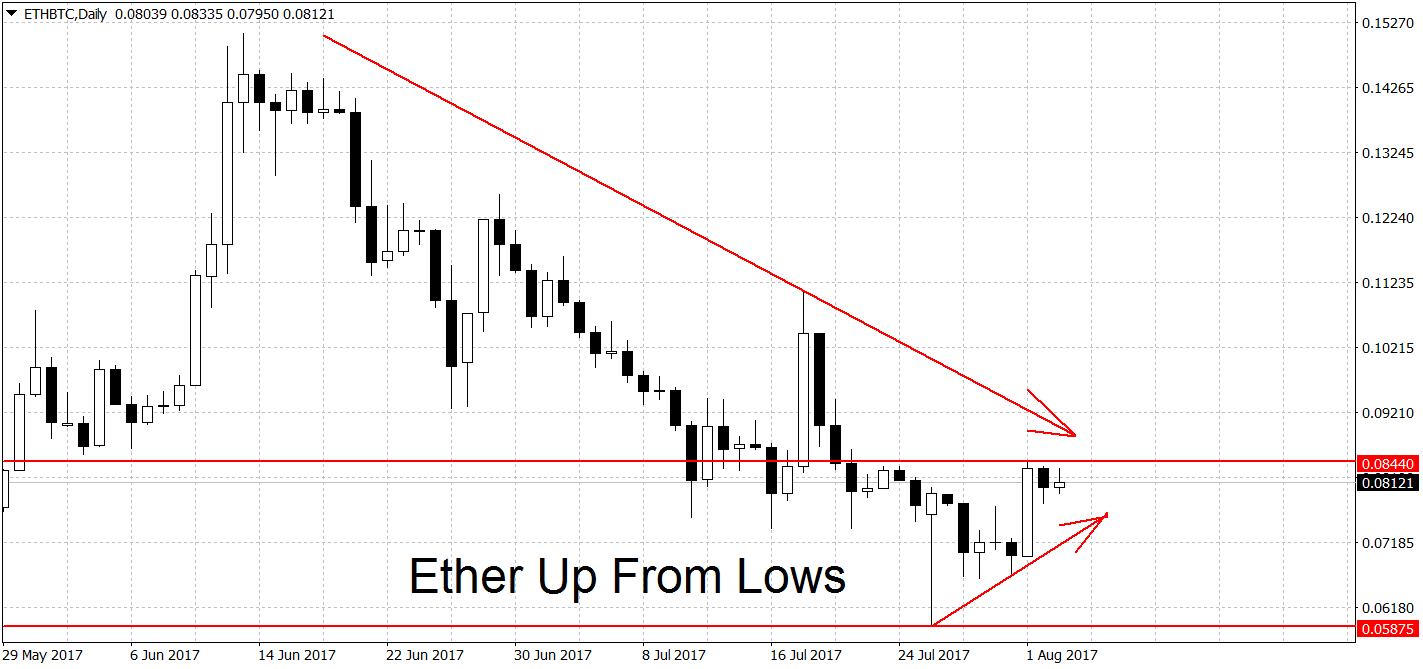
Despite the bounce, however, we’re still in a downtrend on the daily charts. The bulls need a break above the 0.0844 swings high to end the current trend. A new rally requires a break of the 0.111 spike high as well. On the long-term weekly and monthly charts, ETH/BTC is still looking bullish.
Dash Range-bound
We haven’t done a Dash update in a while due to lots of developments in the bitcoin space. Nonetheless, you haven’t missed much as prices here are still in a range. On the chart below we can see that DSH/BTC spent most of the past two months stuck between 0.06 and 0.08134.
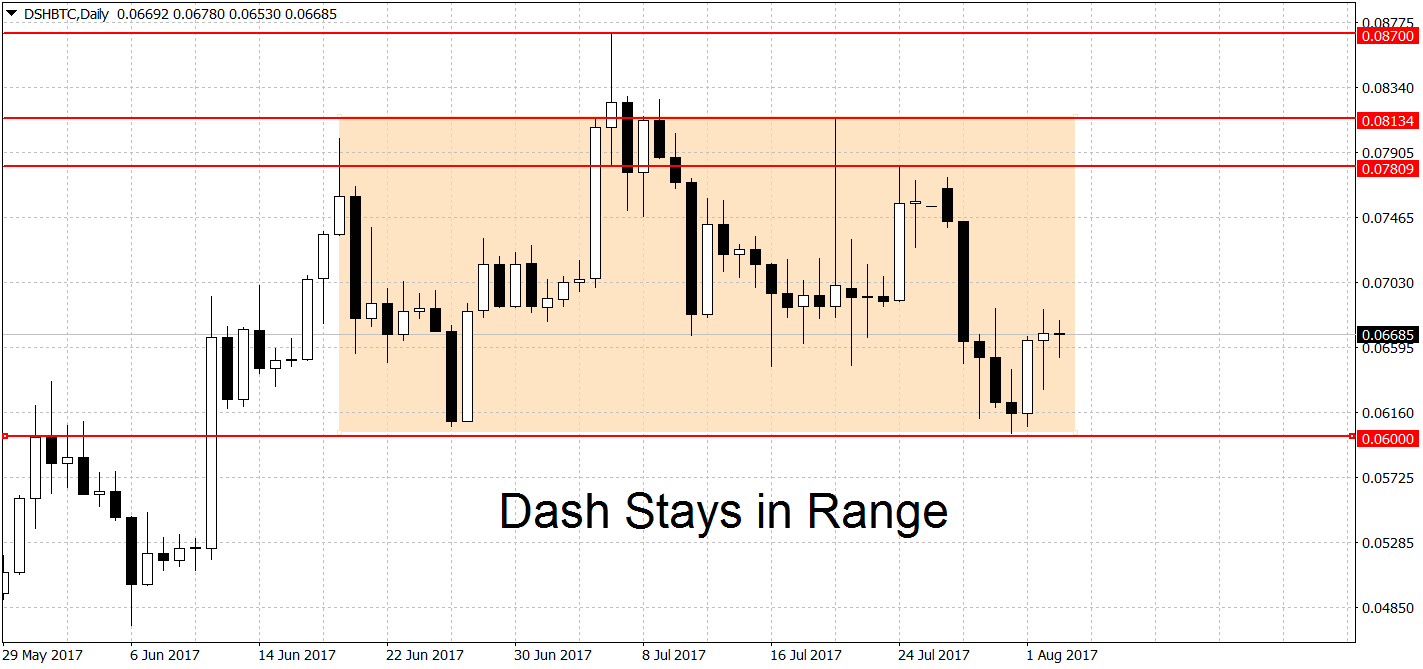
These remain as the two key levels for this pair. A decisive breakout above 0.08134 should start a new Dash rally. Note that, as usual, we’re looking for a sustained break of this price level and not just a brief and shallow spike above.
A new downtrend needs a break below the strong support at 0.06 BTC. This level got tested twice already (at 0.0606 and 0.0602) on the daily charts and held strong so far. A clean break below here could lead to more gains to the 0.05 round figure and even below. On the long-term charts, DSH/BTC is in rally mode as well.
Bitcoin Still in Uptrend
No crypto update is complete without big brother bitcoin. The number one crypto is still holding strong at $2,748, way above the potentially trend-ending level at $2,400. Not much has happened since our last update on Tuesday, with prices in ‘wait and see’ mode after the fork. We’re currently quoted higher by around 1% since then.
The key levels to keep an eye on are $3,000 on the upside and $2,400 on the downside. A decisive break below $2,400 would end the trend on the daily charts. On the other hand, a breakout above the $3,000 round figure could reignite the ‘FOMO‘ and lead to more gains. On the long-term weekly and monthly charts, BTC/USD is in a bullish trend.
FXOpen offers the world's most popular cryptocurrency CFDs*, including Bitcoin and Ethereum. Floating spreads, 1:2 leverage — at your service (additional fees may apply). Open your trading account now or learn more about crypto CFD trading with FXOpen.
*Important: At FXOpen UK, Cryptocurrency trading via CFDs is only available to our Professional clients. They are not available for trading by Retail clients. To find out more information about how this may affect you, please get in touch with our team.
This article represents the opinion of the Companies operating under the FXOpen brand only. It is not to be construed as an offer, solicitation, or recommendation with respect to products and services provided by the Companies operating under the FXOpen brand, nor is it to be considered financial advice.
Stay ahead of the market!
Subscribe now to our mailing list and receive the latest market news and insights delivered directly to your inbox.


Latest articles

Consolidation Ahead of NFP: Commodity Currencies Search for Direction
Commodity-linked currencies have entered a consolidation phase following recent directional moves, as market participants adopt a wait-and-see approach ahead of key US labour market data. Current price action reflects a balance between ongoing demand for the US dollar and attempts

The Real Driver Behind the Dollar Rally: Market Insights with Gary Thomson
The US dollar has been firm, but the drivers behind the move may be more complex than they first appear.
While geopolitical tension and shifts in risk sentiment play a role, current price behaviour seems increasingly influenced by inflation expectations

EUR/USD and USD/CHF Pull Back: Market Reacts to Fundamentals
European currencies have shown a recovery in recent trading sessions after their recent decline, displaying early signs of a reversal. The US dollar is weakening amid expectations surrounding upcoming US macroeconomic data, while market participants are reassessing their short-term positions