


ETHUSD and LTCUSD Technical Analysis – 02nd MAR, 2023
FXOpen

ETHUSD: Three White Soldiers Pattern Above $1558
Ethereum was unable to sustain its bearish momentum and after touching a low of $1558 on 25th Feb, the prices started to correct upwards against the US dollar ranging above the $1640 handle today in the Asian trading session.
The prices of Ethereum are ranging near a new record high of 1 month.
The price of ETHUSD is back over the pivot point in the weekly time frame indicating a bullish scenario.
We can clearly see a three white soldiers pattern above the $1558 handle which is a bullish pattern and signifies the end of a bearish phase and the start of a bullish phase in the markets.
ETH is now trading just above its pivot level of 1645 and moving into a mildly bullish channel. The price of ETHUSD is now testing its classic resistance level of 1650 and Fibonacci resistance level of 1656 after which the path towards 1700 will get cleared.
We can see the formation of the bullish harami pattern in the weekly timeframe.
The relative strength index is at 52.40 indicating a neutral demand for Ether and a shift towards the consolidation phase in the markets.
The commodity channel index, CCI, is giving a neutral signal, which means that the prices are expected to remain in a consolidation phase.
Some of the technical indicators are giving a buy market signal.
Most of the moving averages are giving a buy signal at the current market level of $1645.
ETH is now trading above both the 100 hourly simple and 100 hourly exponential moving averages.
- Ether: bullish reversal seen above the $1558 mark.
- The short-term range appears to be mildly bullish.
- ETH continues to remain above the $1640 level.
- The average true range is indicating less market volatility.
Ether: Bullish Reversal Seen Above $1558

ETHUSD continues to consolidate its gains and is now moving above the $1600 handle with an upside focus of $1700 and $1800 levels.
We can see the formation of the bullish trend reversal pattern with moving averages MA20 in the daily time frame.
The resistance of the channel is broken in the 15-minute time frame indicating a bullish outlook present in the markets.
ETHUSD touched an intraday high of 1677 in the Asian trading session and an intraday low of 1638 in the London trading session today.
The key support levels to watch are $1593 which is a 14-day RSI at 40%, and at $1637 at which the price crosses 18-day moving average stalls.
ETH has decreased by 0.73% with a price change of 12.10$ in the past 24hrs and has a trading volume of 6.909 billion USD.
We can see a decrease of 11.89% in the total trading volume in the last 24 hrs which is due to the market consolidation.
The Week Ahead
ETH has retracted after touching a high of $1677, and after this consolidation phase gets over, we are looking to cross the $1700 handle.
We can see the formation of a bullish ascending channel from $1558 towards the $1691 level.
The immediate short-term outlook for Ether has turned mildly bullish, the medium-term outlook has turned bullish, and the long-term outlook for Ether is neutral in present market conditions.
The resistance zone is located at $1686 which is a 14-3 day raw stochastic at 80% and at $1694 at which the price crosses 9-day moving average stalls.
The weekly outlook is projected at $1750 with a consolidation zone of $1700.
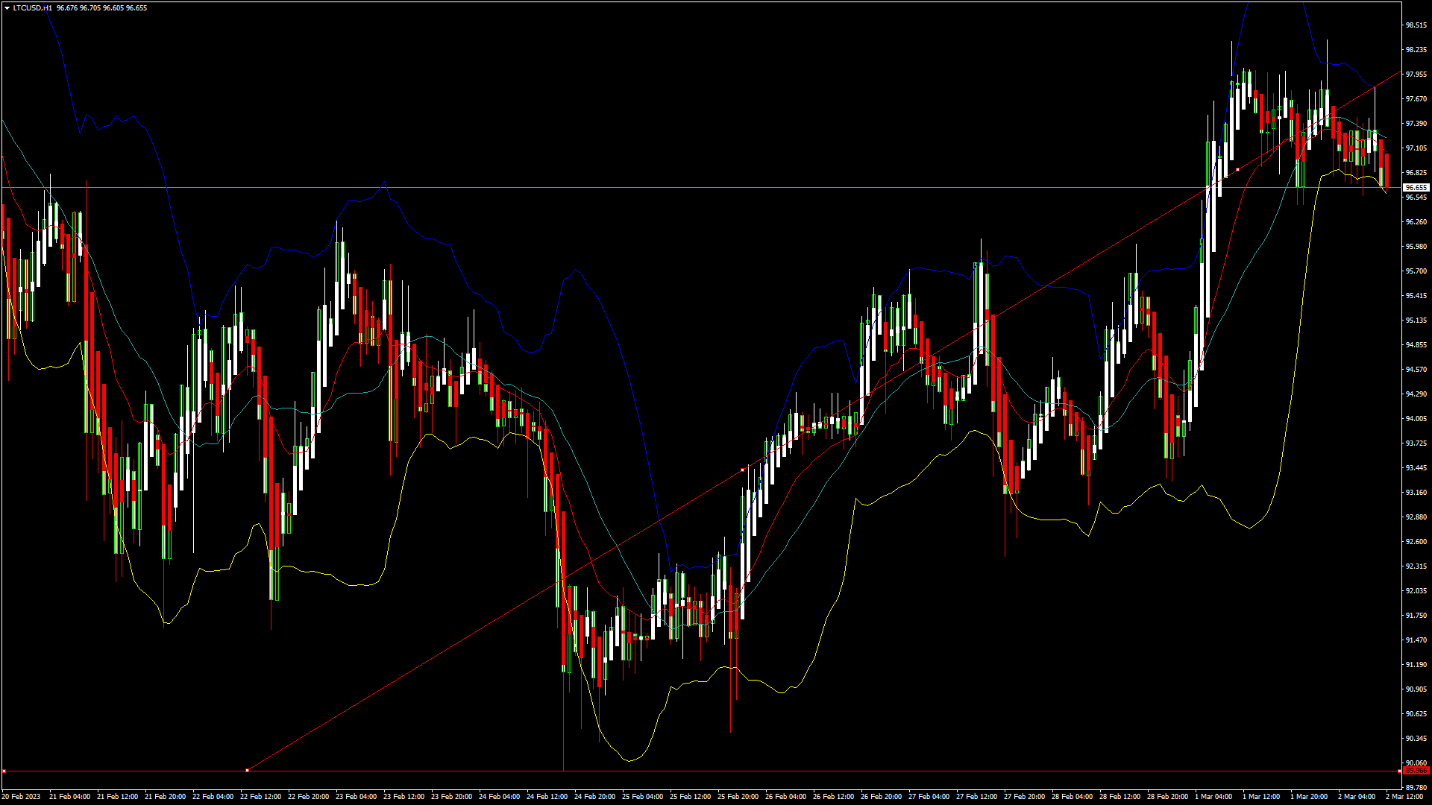
LTCUSD: Hammer Pattern Above $89.96
Litecoin was unable to sustain its bearish momentum last week and after touching a low of $89.96 on 24th Feb, the price started to move upwards against the US dollar ranging above the $96 handle today in the European trading session.
The price is back over the pivot point in the weekly time frame indicating a bullish outlook.
We can clearly see a hammer pattern above the $89.96 handle which is a bullish pattern and signifies the end of a bearish phase and the start of a bullish phase in the markets.
Litecoin is now trading above its 100 hourly simple moving averages and above its 200 hourly simple moving averages. The price of LTCUSD is just below its pivot levels of 97.11.
The relative strength index is at 58.56 indicating a strong demand for Litecoin and the continuation of the buying pressure in the markets.
The price of Litecoin continues to remain above some of the moving averages, which are now giving a buy signal at current market levels of 96.92.
Both the STOCH and STOCHRSI are giving an overbought signal, which means that the prices are expected to decline in the short-term range.
The momentum indicator is back over zero in the 30-minute time frame indicating a bullish trend.
The short-term outlook for Litecoin has turned mildly bullish.
- Some of the technical indicators are giving a STRONG BUY signal.
- Litecoin: bullish reversal seen above the $89.96 levels.
- STOCHRSI is giving an overbought signal.
- The average true range is indicating LESS market volatility.
Litecoin: Bullish Reversal Seen Above $89.96
The price of Litecoin continues to move into a zigzag pattern within a consolidation phase after which we are expecting targets of $100 and $105 levels.
We can see the formation of a Doji pattern in the 15-minute time frame indicating a neutral tone of the markets.
A bullish trend reversal pattern is visible with the moving average MA20 in the daily time frame.
The price of LTCUSD is now facing its classic resistance level of 97.63 and Fibonacci resistance level of 97.96 after which the path towards $100 will get cleared.
Litecoin touched an intraday high of $98.34 in the Asian trading session and an intraday low of $96.53 in the European trading session today.
Litecoin is now facing its resistance zone at $100.26 which is a 14-3 day raw stochastic at 70% and at $100.71 at which the price crosses 9-day moving average stalls.
LTCUSD has decreased by 1.03% with a price change of 1.00$ in the past 24hrs and has a trading volume of 0.441 billion USD.
Litecoin’s trading volume has decreased by 19.14% compared to yesterday which is due to the market consolidation.
The Week Ahead
The price of Litecoin continues to move in a zigzag pattern above the $96 handle, and we are now aiming to touch the $100 level.
The price of Litecoin needs to remain above the important support level of $93.50 which is a 14-3 day raw stochastic at 20% and at $94.89 which is a 38.2% retracement from 4-week low.
The short-term outlook for Litecoin has turned mildly bullish, the medium-term outlook is bullish, and the long-term outlook is neutral at present market conditions.
The weekly outlook is projected at $105 with a consolidation zone of $100.
FXOpen offers the world's most popular cryptocurrency CFDs*, including Bitcoin and Ethereum. Floating spreads, 1:2 leverage — at your service (additional fees may apply). Open your trading account now or learn more about crypto CFD trading with FXOpen.
*Important: At FXOpen UK, Cryptocurrency trading via CFDs is only available to our Professional clients. They are not available for trading by Retail clients. To find out more information about how this may affect you, please get in touch with our team.
This article represents the opinion of the Companies operating under the FXOpen brand only. It is not to be construed as an offer, solicitation, or recommendation with respect to products and services provided by the Companies operating under the FXOpen brand, nor is it to be considered financial advice.
Stay ahead of the market!
Subscribe now to our mailing list and receive the latest market news and insights delivered directly to your inbox.


Latest articles

Weekly Market Insights with Gary Thomson: The Week of Central Banks and Earnings
In this video, we’ll explore the key economic events and market trends, shaping the financial landscape. Get ready for insights into financial markets to help you navigate the week ahead. Let’s dive in!
In this episode of Market

Intel at a Crossroads: Earnings Beat Meets Technical Resistance
Intel has just delivered its strongest quarter in over fifteen years, and the market reaction says it all. Q2 2026 revenue surged 25% year-over-year to $16.1 billion, crushing the consensus estimate of $14.42 billion, while adjusted EPS of

Tesla: Complex Range Structure Breaks Down Following Quarterly Earnings
Tesla released its Q2 2026 results after the market closed on 22 July. Revenue increased 26% year-on-year to $28.24 billion, while vehicle deliveries reached a record 480,126 units. However, operating margin fell sharply to 1.4%, down from