


ETHUSD and LTCUSD Technical Analysis – 04th AUG, 2022
FXOpen

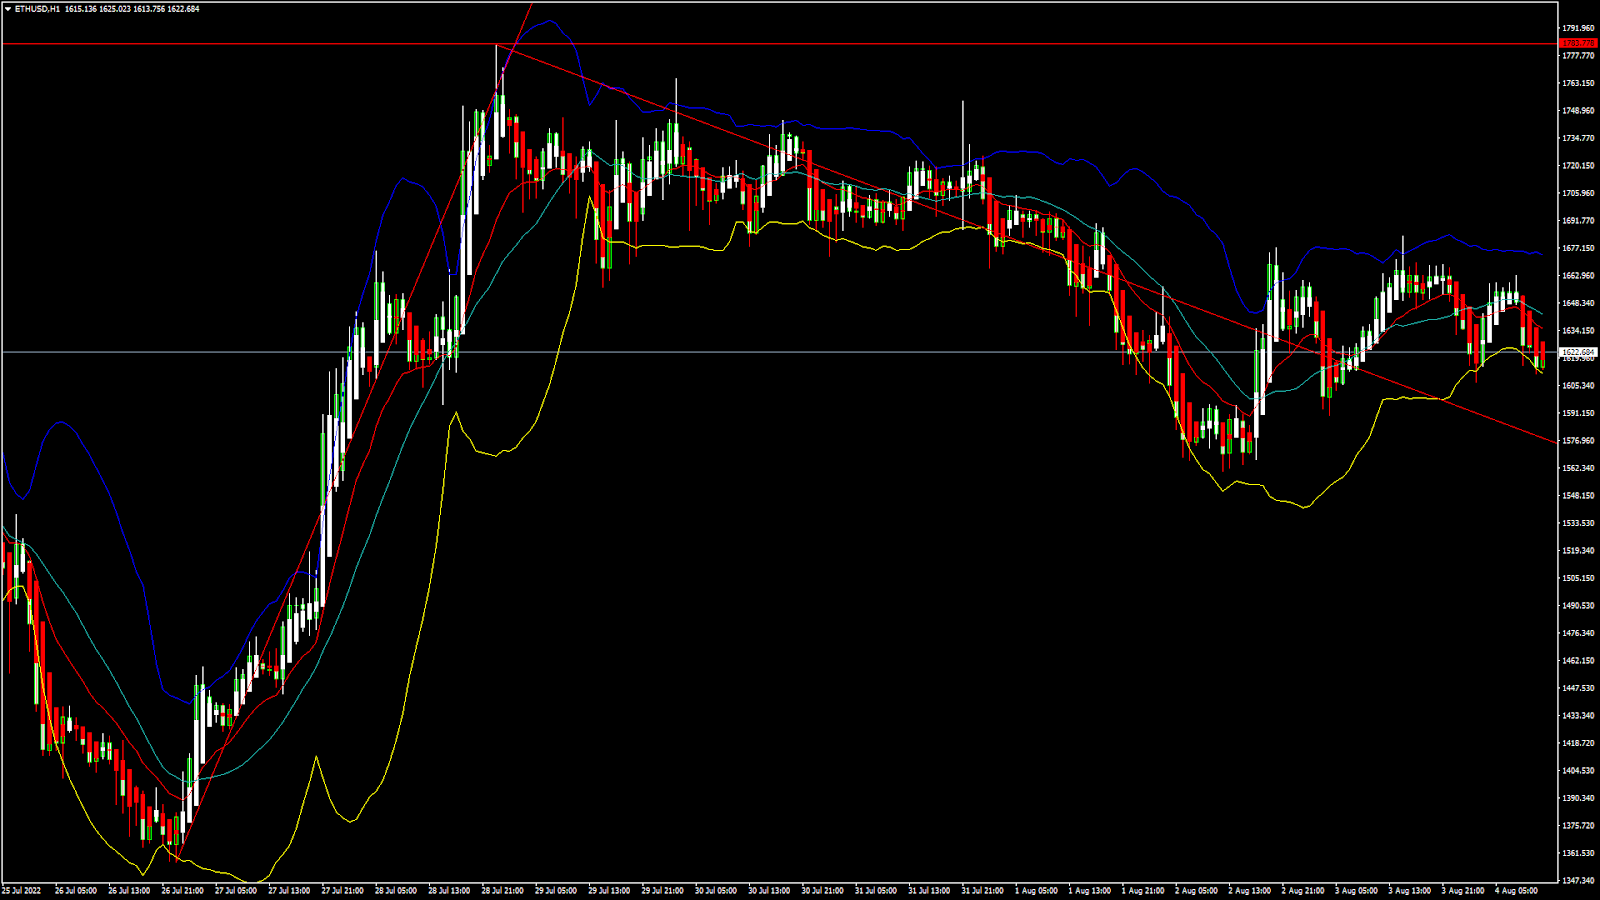
ETHUSD: Three Inside Down Pattern Below $1783
Ethereum was unable to sustain its bullish momentum and after touching a high of 1762 on 30th July started to decline against the US dollar coming down below the $1600 handle on 02nd Aug.
The selloff that we saw was due to the strength of the US dollar and its subsequent effect on the price of ETHUSD.
We can clearly see three inside down pattern below the $1783 handle which is a bearish pattern and signifies the end of a bullish phase and the start of a bearish phase in the markets.
ETH is now trading just above its pivot level of 1619 and moving into a mildly bearish channel. The price of ETHUSD is now testing its classic support level of 1591 and Fibonacci support level of 1612 after which the path towards 1600 will get cleared.
The relative strength index is at 40 indicating a WEAK market and the continuation of the downtrend in the markets.
We can see that the Aroon indicator is giving the bearish signal in the 2-hour time frame.
Both the STOCHRSI and Williams percent range are indicating an oversold market, which means that the prices are due for an upwards correction.
All of the technical indicators are giving a strong sell market signal.
All of the moving averages are giving a strong sell signal and we are now looking at the levels of $1600 to $1550 in the short-term range.
ETH is now trading below both the 100 Hourly Simple and Exponential moving averages.
- Ether: bearish reversal seen below the $1783 mark
- The short-term range appears to be mildly bearish
- ETH continues to remain above the $1600 levels
- The average true range is indicating less market volatility
Ether: Bearish Reversal Seen Below $1783
ETHUSD is now moving into a mildly bearish channel with the prices trading above the $1600 handle in the European trading session today.
We have also detected the formation of the adaptive moving average, 20 and 50 crossover pattern in the 2 hourly time frame indicating that the price is likely to descend in the short-term range.
We can see the formation of a major contraction triangle below the $1700 level in the 1-hour time frame.
The key support levels to watch are $1595 and $1506, and the price of ETHUSD needs to remain above these levels for any potential bullish reversal in the markets.
ETH has decreased by 1.93% with a price change of $31 in the past 24hrs and has a trading volume of 15.964 billion USD.
We can see a decrease of 14.86% in the total trading volume in the last 24 hrs which appears to be normal.
The Week Ahead
We can see that ETH failed to clear its major resistance zone located at $1800 level and is now preparing to enter a consolidation phase above the $1600 level.
The price of Ethereum is slowly recovering against the US dollar, and we can see some range-bound moves in the short-term range.
The immediate short-term outlook for Ether has turned mildly bearish, the medium-term outlook remains neutral, and the long-term outlook for Ether is neutral in present market conditions.
The price of ETHUSD will need to remain above the important support level of $1500 this week.
The weekly outlook is projected at $1650 with a consolidation zone of $1500.
Technical Indicators:
Relative Strength Index (14): It is at 40.99 indicating a SELL.
Moving Averages Convergence Divergence (12,26): It is at -1.66 indicating a SELL.
Rate of Price Change: It is at -2.17 indicating a SELL.
Ultimate Oscillator: It is at 31.86 indicating a SELL.
LTCUSD: Bearish Engulfing Pattern Below $64
Litecoin was unable to sustain its bullish momentum last week, and after touching a high of $64 on 29th July started to decline against the US dollar touching a low of $56 on 2nd Aug.
We can see that the prices of Litecoin are in a neutral zone as we can see both upswings and downswings in the markets.
We can clearly see a bearish engulfing pattern below the $64 handle which is a bearish pattern and signifies the end of a bullish phase and the start of a bearish phase.
Litecoin is now trading below its 100 hourly simple moving average and 100 hourly exponential moving average. The price of LTCUSD is just above its pivot level of 58.49
The relative strength index is at 48 indicating a neutral market, and the continuation of the consolidation phase in the markets.
Litecoin touched an intraday high of $59 and an intraday low of $57 in the Asian trading session today.
The prices of Litecoin continue to remain below most of the moving averages, some of which are now giving a sell signal at current market level of 58.74.
Both the STOCHRSI and commodity channel index are indicating a neutral level, which means that the prices are expected to remain in a narrow range in the short-term range.
The short-term outlook for Litecoin has turned mildly bearish.
- Some of the Technical Indicators are giving a buy signal
- Litecoin: bearish reversal seen below the $64 levels
- The highs/lows Index is indicating a neutral level
- The average true range is indicating less market volatility
Litecoin: Bearish Reversal Seen Below $64

We can see that the prices of Litecoin continue to remain in the consolidation phase and are now trading above the $58 handle in the European Trading session today.
We can see the formation of a MA5 and MA50 crossover pattern located at 58.50 and 58.52 indicating that at these levels, a pullback action is expected in the markets.
The price of LTCUSD is now facing its classic support level of 57.93 and Fibonacci support level of 58.34 after which the path towards $55 will get cleared.
We saw that Litecoin failed to clear its resistance zone located at $65 and is now moving towards the $55 level.
The daily RSI is printing at 53 which is indicating a neutral market and the continuation of the consolidation phase in the short-term range.
LTC has decreased by 0.46% with a price change of 0.2695$ in the past 24hrs and has a trading volume of 0.436 billion USD.
Litecoin’s trading volume has decreased by 17.83% compared to yesterday which appears to be normal.
The Week Ahead
We can see a continued progression of the Bearish Trend line from $64 towards $56. Now as the bullish trend fades, we are looking for more downsides below the $55 level this week.
The price of Litecoin needs to remain above the $55 handle for any potential bullish reversal in the markets.
The short-term outlook for Litecoin has turned mildly bearish, the medium-term outlook is neutral, and the long-term outlook is neurtal at present market conditions.
The weekly outlook is projected at $55 with a consolidation zone of $50.
Technical Indicators:
The relative strength index (14 days): at 49 indicating a NEUTRAL
The ultimate oscillator: at 43.27 indicating a SELL
The rate of price change: at -1.17 indicating a SELLBull/Bear power (13): at -0.08 indicating a SELL
FXOpen offers the world's most popular cryptocurrency CFDs*, including Bitcoin and Ethereum. Floating spreads, 1:2 leverage — at your service (additional fees may apply). Open your trading account now or learn more about crypto CFD trading with FXOpen.
*Important: At FXOpen UK, Cryptocurrency trading via CFDs is only available to our Professional clients. They are not available for trading by Retail clients. To find out more information about how this may affect you, please get in touch with our team.
This article represents the opinion of the Companies operating under the FXOpen brand only. It is not to be construed as an offer, solicitation, or recommendation with respect to products and services provided by the Companies operating under the FXOpen brand, nor is it to be considered financial advice.
Stay ahead of the market!
Subscribe now to our mailing list and receive the latest market news and insights delivered directly to your inbox.


Latest articles

EUR/USD and GBP/USD consolidate ahead of the Fed decision
European currencies are showing subdued dynamics, entering a consolidation phase following their previous advance. Earlier, EUR/USD and GBP/USD broke out of their ranges and strengthened; however, the subsequent correction has led both pairs to retest the previously breached

Meta: V-Shaped Recovery Meets Heavy Volume Resistance
The movement in Meta Platforms shares is being driven by two competing narratives. On one hand, advertising revenue is benefiting from AI-based tools: the Advantage+ platform continues to support strong advertiser demand, and the analyst consensus for Q1 2026 revenue

Commodity Currencies Test Key Levels Ahead of Major Macro Data
Commodity-linked currencies are trading near key levels, showing restrained price action as market participants adopt a wait-and-see approach. The fundamental backdrop is shaped by expectations surrounding the release of Australia’s inflation data and the Bank of Canada’s interest