


FXOpen

ETHUSD: Hanging Man Pattern Below $1627
Ethereum was unable to sustain its bullish momentum and after touching a high of 1627 on 19th July started to decline against the US dollar coming down below the $1500 handle in the European trading session today.
We can see that ETH is losing ground against the US dollar and no major uptrend formation was seen.
The prices touched an intraday low of $1466 and an intraday high of $1565 in the Asian trading session today.
We can clearly see a hanging man pattern below the $1627 handle which is a bearish pattern and signifies the end of a bullish phase and the start of a bearish phase in the markets.
ETH is now trading just above its pivot levels of 1485 and moving into a mildly bearish channel. The price of ETHUSD is now testing its classic support level of 1450 and Fibonacci support level of 1476 after which the path towards 1300 will get cleared.
The relative strength index is at 39 indicating a weak market and the continuation of the downtrend in the markets.
We can see the progression of a bearish trendline formation from $1627 to $1488 which indicates that we are heading towards $1436.
Both the commodity channel index and Williams percent range are indicating a neutral market.
All of the technical indicators are giving a strong sell market signal.
Most of the moving averages are giving a sell signal, and we are now looking at the levels of $1400 to $1350 in the short-term range.
ETH is now trading above both its 100 hourly simple and exponential moving averages.
- Ether: bearish reversal seen below the $1627 mark
- Short-term range appears to be mildly bearish
- ETH continues to remain above $1400
- The average true range is indicating less market volatility
Ether: Bearish Reversal Seen Below $1627
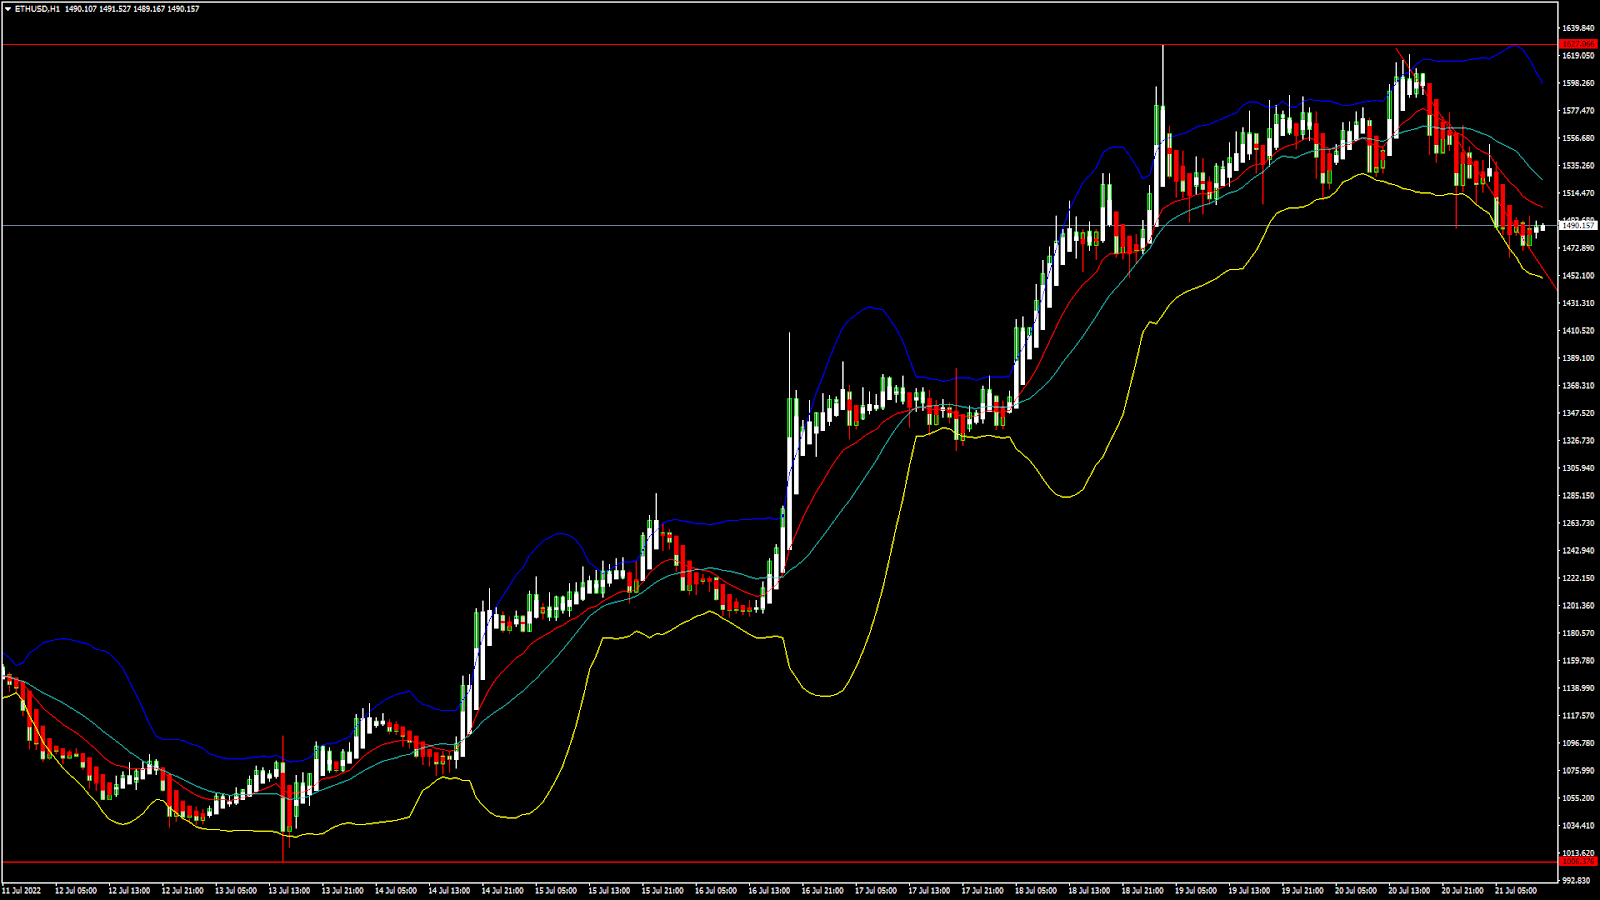
ETHUSD is now moving into a mildly bearish channel with the prices trading below the $1500 handle in the European trading session today.
We have also detected the formation of MA20 and MA50 crossover patterns located at 1529 and 1545 in the hourly time frame indicating that the price is likely to descend below.
We can see that the prices of Ethereum are slowly preparing for moving into a consolidation channel above the $1400 handle.
We can also see the formation of three black crows patterns in the 15-minute time frame indicating the bearish nature of the markets.
In the 2-hour time frame, the super trend indicator is giving bearish reversal signals.
The key support levels to watch are $1385 and $1335, and the prices of ETHUSD need to remain above these levels for any potential bullish reversal in the markets.
ETH has decreased by 2.79% with a price change of 42$ in the past 24hrs and has a trading volume of 23.086 billion USD.
We can see an increase of 2.31% in the total trading volume in the last 24 hrs. which appears to be normal.
The Week Ahead
We can see that ETH failed to clear the resistance zone located at $1650, and with the continued bearish reversal, we are now heading towards the $1400 level.
The prices of Ethereum are preparing to enter into a consolidation phase below the $1500 level and we can see some range-bounded movements between the $1400 and $1500 levels this week.
The immediate short-term outlook for Ether has turned mildly bearish; the medium-term outlook has turned neutral; and the long-term outlook for Ether is neutral in present market conditions.
The price of ETHUSD will need to remain above the important support level of $1400 this week.
The weekly outlook is projected at $1550 with a consolidation zone of $1400.
Technical Indicators:
STOCH (9,6): at 22.50 indicating a sell
The moving averages convergence divergence (12,26): at -17.75 indicating a sell
The rate of price change: at -3.93 indicating a sell
The ultimate oscillator: at 46.50 indicating a sell
LTCUSD: Double Top Pattern Below $61
Litecoin was unable to sustain its bullish momentum last week and after touching a high of $61 on 20th July started to decline against the US dollar touching a low of $55 today in the European trading session.
We can see that after this decline the prices of Litecoin have entered into a consolidation channel above the $55 handle.
We can clearly see a double top pattern below the $61 handle which is a bearish pattern and signifies the end of a bullish phase and the start of a bearish phase.
Litecoin is now trading below its 100 hourly simple moving averages and 100 hourly exponential moving averages. The price of LTCUSD is just above its pivot levels of 56.30
The relative strength index is at 44 indicating a weak market, and the continuation of the downtrend in the markets.
Litecoin touched an intraday high of $58 and an intraday low of $55 in the Asian trading session today.
The prices of Litecoin continue to remain below most of the moving averages, some of which are now giving a sell signal at current market level of 56.32.
The STOCHRSI is indicating an overbought level, which means that the prices are due to correct downwards in the short-term range.
The short-term outlook for Litecoin has turned mildly bearish.
- Most of the technical indicators are giving a strong sell signal
- Litecoin: Bearish reversal seen below the $61 level
- The commodity channel index is indicating a neutral level
- The average true range is indicating less market volatility
Litecoin: Bearish Reversal Seen Below $61

We can see that the prices of Litecoin continue to remain in the consolidation phase and are now trading above the $55 handle in the European trading session today.
We can see the formation of a bearish trendline with a continued progression from $61 towards the $53 level.
The price of LTCUSD is now facing its classic support level of 55.56 and Fibonacci support level of 56.11 after which the path towards $50 will get cleared.
Litecoin’s price continues to suffer losses due to the strength of the US dollar as many medium-term investors are selling due to weaker global sentiments.
We have also detected the formation of adaptive moving Aaverage crossover patterns of AMA20 and AMA50 indicating the bearish nature of the markets.
The daily RSI is printing at 55 which is indicating a neutral market and the continuation of the consolidation phase in the short-term range.
LTC has decreased by 2.15% with a price change of 1.24$ in the past 24hrs and has a trading volume of 0.630 Billion USD.
Litecoin’s trading volume has increased by 11.50% compared to yesterday which appears to be normal.
The Week Ahead
We can see that Litecoin failed to clear the resistance zone located at $65, and now we are heading towards the $55 level.
If the selling pressure continues, then we may see a linear progression of this downtrend towards the $53 and $50 levels.
The prices of Litecoin need to remain above the $50 handle for any potential bullish reversal in the markets.
The short-term outlook for Litecoin has turned mildly bearish, the medium-term outlook is neutral, and the long-term outlook is neutral at present market conditions.
The weekly outlook is projected at $55 with a consolidation zone of $50.
Technical Indicators:
The relative strength index (14 days): at 43indicating a sell
The moving averages convergence divergence (12,26): at -0.518 indicating a sell
The rate of price change: at -4.10 indicating a sell
Bull/Bear power (13): at -0.48 indicating a sell
FXOpen offers the world's most popular cryptocurrency CFDs*, including Bitcoin and Ethereum. Floating spreads, 1:2 leverage — at your service (additional fees may apply). Open your trading account now or learn more about crypto CFD trading with FXOpen.
*Important: At FXOpen UK, Cryptocurrency trading via CFDs is only available to our Professional clients. They are not available for trading by Retail clients. To find out more information about how this may affect you, please get in touch with our team.
This article represents the opinion of the Companies operating under the FXOpen brand only. It is not to be construed as an offer, solicitation, or recommendation with respect to products and services provided by the Companies operating under the FXOpen brand, nor is it to be considered financial advice.
Stay ahead of the market!
Subscribe now to our mailing list and receive the latest market news and insights delivered directly to your inbox.


Latest articles

Consolidation Ahead of NFP: Commodity Currencies Search for Direction
Commodity-linked currencies have entered a consolidation phase following recent directional moves, as market participants adopt a wait-and-see approach ahead of key US labour market data. Current price action reflects a balance between ongoing demand for the US dollar and attempts

The Real Driver Behind the Dollar Rally: Market Insights with Gary Thomson
The US dollar has been firm, but the drivers behind the move may be more complex than they first appear.
While geopolitical tension and shifts in risk sentiment play a role, current price behaviour seems increasingly influenced by inflation expectations

EUR/USD and USD/CHF Pull Back: Market Reacts to Fundamentals
European currencies have shown a recovery in recent trading sessions after their recent decline, displaying early signs of a reversal. The US dollar is weakening amid expectations surrounding upcoming US macroeconomic data, while market participants are reassessing their short-term positions