


ETHUSD and LTCUSD Technical Analysis – 23rd FEB, 2023
FXOpen
ETHUSD: Hammer Pattern Above $1596
Ethereum was unable to sustain its bearish momentum and after touching a low of 1596 on 22nd Feb, the price started to correct upwards against the US dollar crossing the $1650 handle today in the European trading session.
We have seen a bullish opening of the markets this week.
We can clearly see a hammer pattern above the $1596 handle which is a bullish pattern and signifies the end of a bearish phase and the start of a bullish phase in the markets.
ETH is now trading just below its pivot level of 1666 and moving into a mildly bullish channel. The price of ETHUSD is now testing its classic resistance level of 1669 and Fibonacci resistance level of 1671 after which the path towards 1700 will get cleared.
The relative strength index is at 61.93 indicating a strong demand for Ether and the continuation of the bullish phase in the markets.
We can see the formation of bullish engulfing lines in the daily time frame.
Both the STOCH and STOCHRSI are indicating an overbought market, which means that the prices are expected to decline in the short-term range.
Most of the technical indicators are giving a strong buy market signal.
Most of the moving averages are giving a strong buy signal, and we are now looking at the levels of $1700 to $1750 in the short-term range.
ETH is now trading above its 100 & 200 hourly simple and exponential moving averages.
- Ether: bullish reversal seen above the $1596 mark.
- The short-term range appears to be strongly bullish.
- ETH continues to remain above the $1650 levels.
- The average true range is indicating less market volatility.
Ether: Bullish Reversal Seen Above $1596
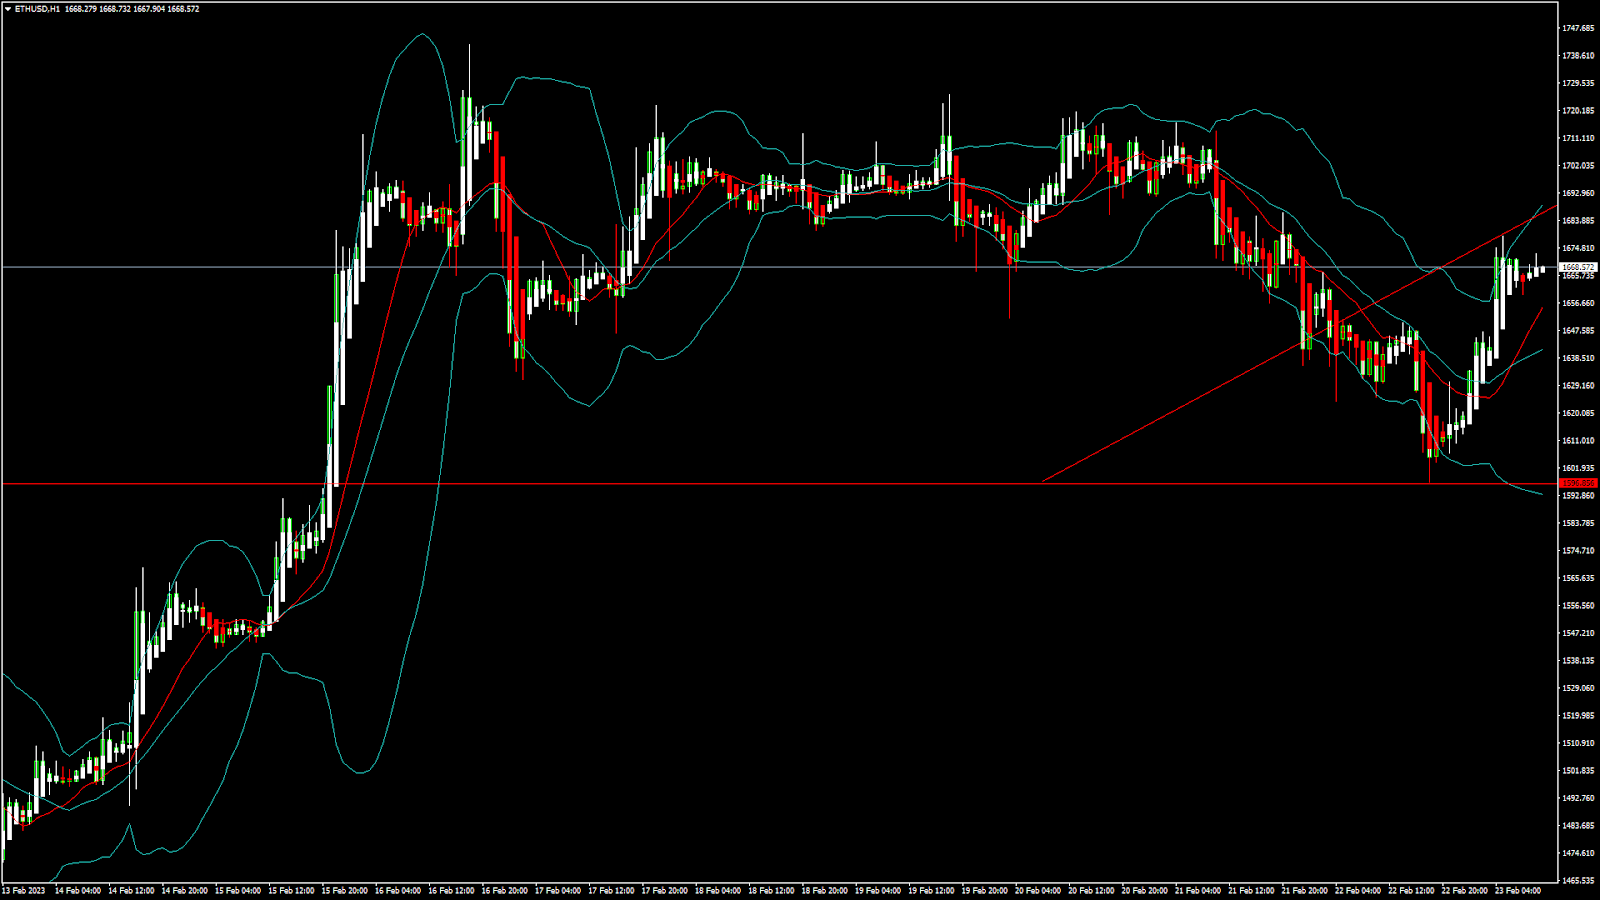
ETHUSD is now moving in a strongly bullish channel with the prices trading above the $1650 handle in the European trading session today.
ETH touched an intraday low of 1637 and an intraday high of 1678 in the Asian trading session today.
The horizontal resistance is broken in the daily time frame, indicating bullish trends.
The MACD crosses up its moving average in the 4-hour time frame indicating bullish nature of the markets.
The Ichimoku – bullish crossover: Tenkan and Kjiun patterns are visible which is a bulish indication of the markets.
The Ichimoku price is over the cloud in the 1-hour time frame indicating a bullish scenario.
The Aroon indicator is giving a bullish trend in the 15-minute time frame.
The key support levels to watch are $1603 which is a 50% retracement from a 4-week high/low, and $1631 at which the price crosses the 9-day moving average.
ETH has increased by 1.84% with a price change of 30.19$ in the past 24hrs and has a trading volume of 8.818 billion USD.
We can see an increase of 1.15% in the total trading volume in the last 24 hrs which appears to be normal.
The Week Ahead
ETH’s price continues to remain in a bullish zone against the US dollar and bitcoin. ETHUSD is expected to move higher towards the $1700 and $1800 levels this week.
On the upside we are now looking at the immediate targets of 1724 which is a pivot point 3rd level resistance, and 1741 which is a 13-week high.
The immediate short-term outlook for Ether has turned strongly bullish, the medium-term outlook has turned bullish, and the long-term outlook for Ether is neutral in present market conditions.
The price of ETHUSD will need to remain above the important support level of $1628 which is a pivot point.
The weekly outlook is projected at $1800 with a consolidation zone of $1750.
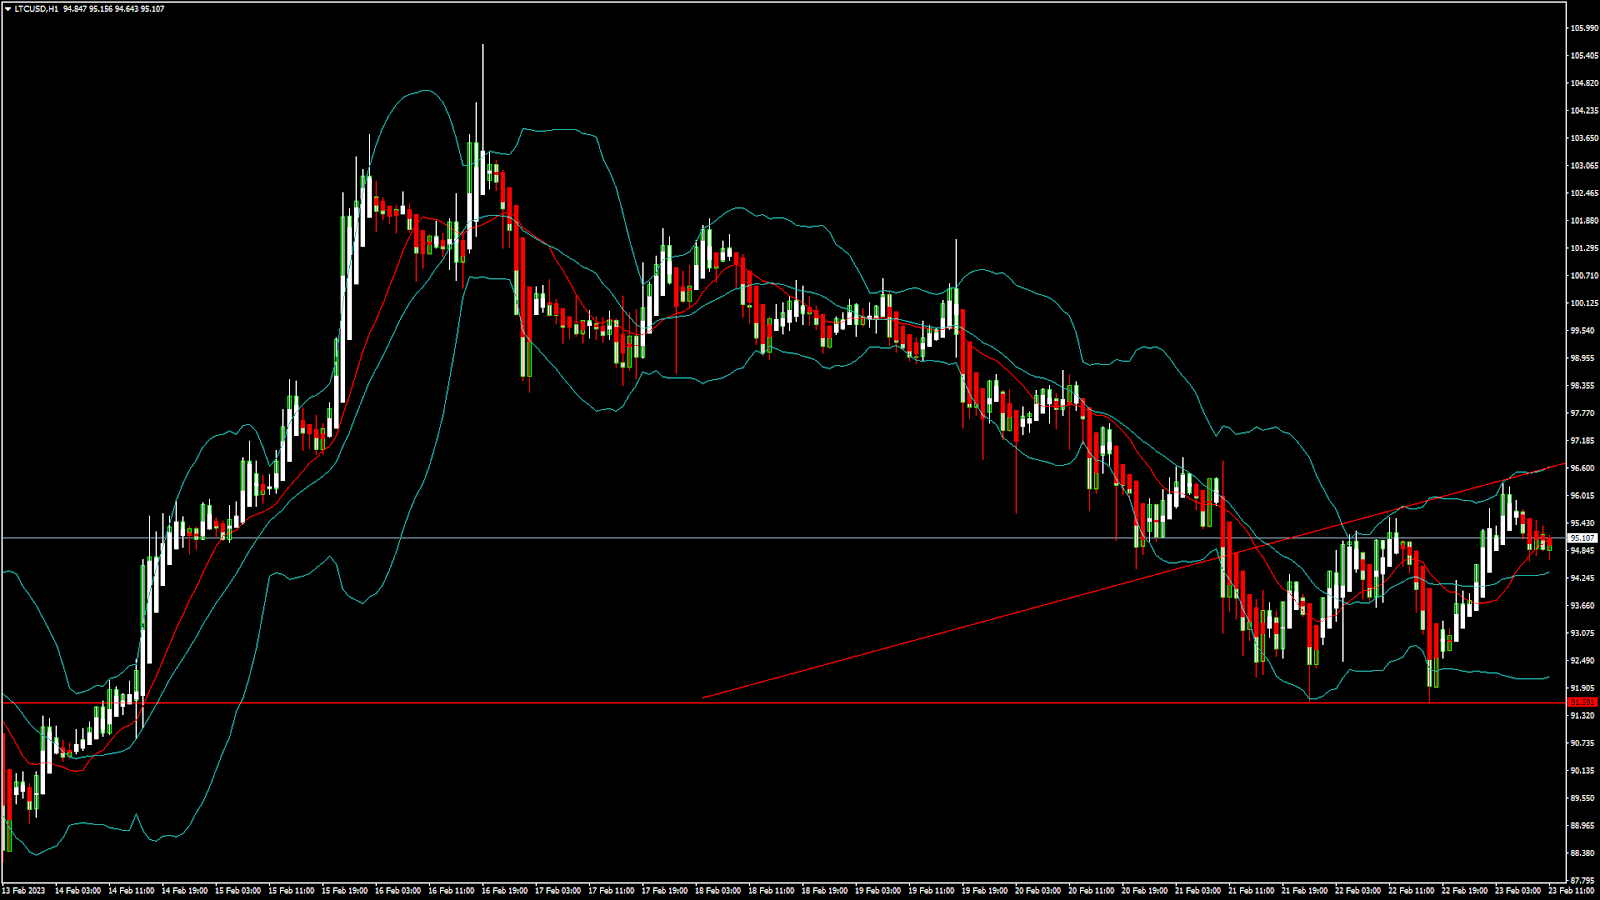
LTCUSD: Double Bottom Pattern Above $91.59
Litecoin was unable to sustain its bearish momentum last week, and after touching a Low of $91.59 on 22nd Feb, the price started to correct upwards against the US dollar crossing the $90 handle today in the early Asian trading session.
The CCI indicator is overbought and gives a neutral signal.
We can clearly see a double bottom pattern above the $91.59 handle which is a bullish pattern and signifies the end of a bearish phase and the start of a bullish phase in the markets.
Litecoin is now trading below its 100 hourly simple moving averages and below its 200 hourly exponential moving averages. The price of LTCUSD is just above its pivot level of 94.99.
The relative strength index is at 50.47 indicating a neutral demand for Litecoin and the continuation of the bullish phase in the markets.
The RSI indicator is back over zero in the 30-minute time frame.
Litecoin touched an intraday high of $96.22 in the Asian trading session and an intraday low of $94.67 in the European trading session today.
The price of Litecoin continues to remain above most of the moving averages, which are now giving a strong buy signal at the current market level of 95.08.
The STOCHRSI is indicating oversold levels, which means that the price is expected to correct upwards in the short-term range.
The short-term outlook for Litecoin has turned mildly bullish.
- Most of the technical indicators are giving a BUY signal.
- Litecoin: bullish reversal seen above the $91.59 level.
- High/low is indicating neutral levels.
- The average true range is indicating high market volatility.
Litecoin: Bullish Reversal Seen Above $91.59
We can see that the price of Litecoin continues to gain traction against the US dollar and bitcoin. We are now looking to touch the $100 level.
The prices are ranging near the support of the channel in the 15-minute time frame indicating bullish trends.
Some of the technical indicators are giving a neutral stance of the markets.
The price of LTCUSD is now facing its classic resistance level of 95.17 and Fibonacci resistance level of 95.51 after which the path towards $100 will get cleared.
We can see continued buying support at the lower levels in Litecoin.
The price of Litecoin is facing a resistance zone located at $96.88 which is a 14-3 day raw stochastic at 50%.
LTCUSD has decreased by 0.20% with a price change of 0.1943$ in the past 24hrs and has a trading volume of 0.547 billion USD.
Litecoin’s trading volume has decreased by 22.68$ compared to yesterday which appears to be normal.
The Week Ahead
The prices of Litecoin remain supported at lower levels and now we are looking to gain strength above the $95 handle.
We can see the formation of an ascending channel from $91.59 towards the $96.69 level.
The price of Litecoin needs to remain above the important support level of 93.08 at which the price crosses 9-day moving average stalls.
The short-term outlook for Litecoin has turned mildly bullish, the medium-term outlook is bullish, and the long-term outlook is neutral at present market conditions.
The weekly outlook is projected at $100 with a consolidation zone of $95.
FXOpen offers the world's most popular cryptocurrency CFDs*, including Bitcoin and Ethereum. Floating spreads, 1:2 leverage — at your service (additional fees may apply). Open your trading account now or learn more about crypto CFD trading with FXOpen.
*Important: At FXOpen UK, Cryptocurrency trading via CFDs is only available to our Professional clients. They are not available for trading by Retail clients. To find out more information about how this may affect you, please get in touch with our team.
This article represents the opinion of the Companies operating under the FXOpen brand only. It is not to be construed as an offer, solicitation, or recommendation with respect to products and services provided by the Companies operating under the FXOpen brand, nor is it to be considered financial advice.
Stay ahead of the market!
Subscribe now to our mailing list and receive the latest market news and insights delivered directly to your inbox.


Latest articles

AUD/CAD: Months of Indecision — Is a Breakout Finally Coming?
The Australian dollar has clawed back most of its end-of-June losses, when it touched three-month lows against the greenback amid escalating Middle East tensions. Since then, sentiment has improved: the RBA's Assistant Governor Sarah Hunter signalled the board stands ready

USD/JPY: Battling at the Top of the Triangle
On 3 July, Japan's Finance Minister, Satsuki Katayama, stated that the Ministry of Finance remains in close contact with US authorities regarding developments in USD/JPY as the yen traded near its weakest level in almost 40 years. Similar verbal

Dow Jones (DJIA): Consolidation Beyond the Trend
Federal Reserve Chair Kevin Warsh testified before Congress on 14–15 July, reaffirming the Fed's commitment to bringing inflation back to target while providing no clear guidance on the future path of interest rates. Meanwhile, June inflation data came in