


ETHUSD and LTCUSD Technical Analysis – 28th JULY, 2022
FXOpen

ETHUSD: Bullish Engulfing Pattern Above $1357
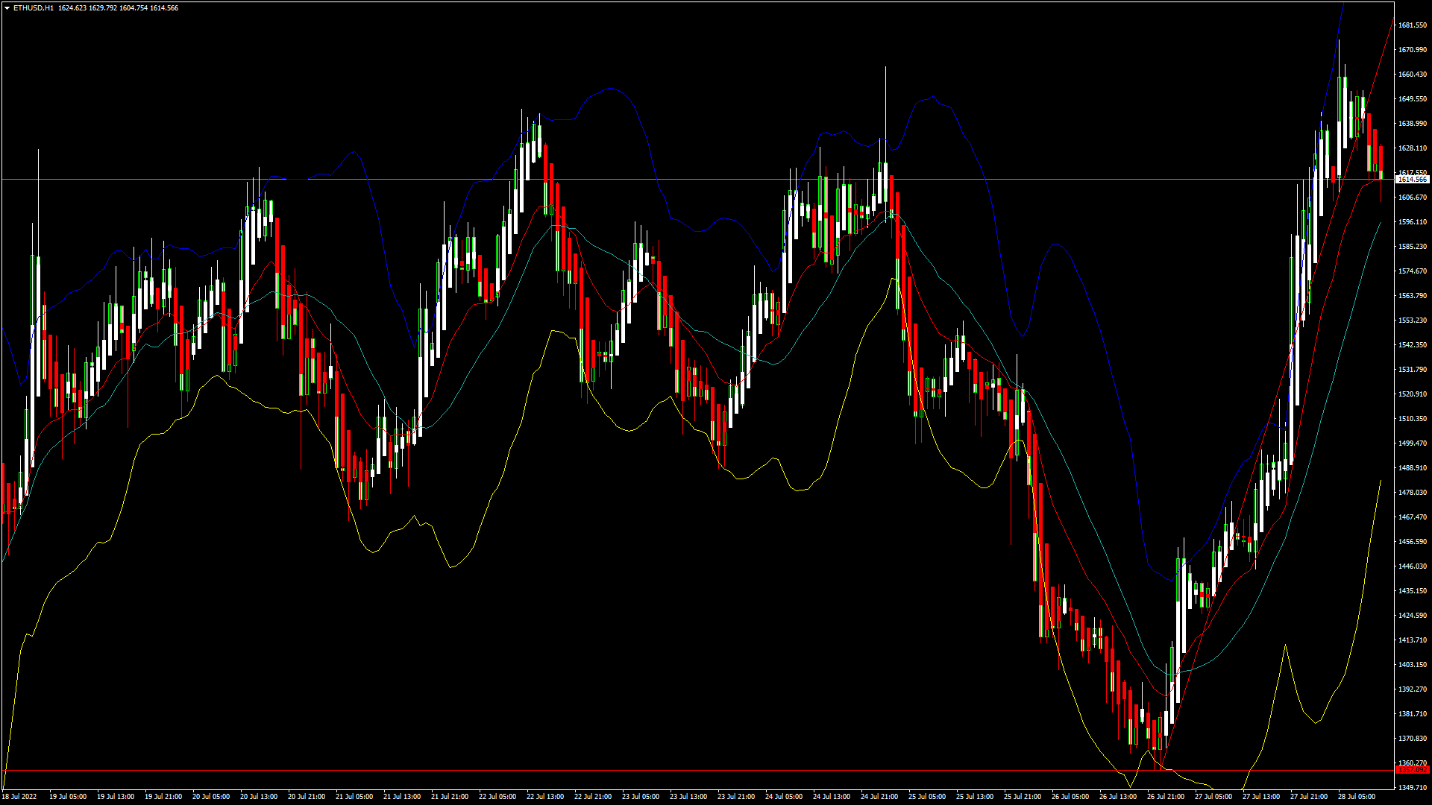
Ethereum was unable to sustain its bullish momentum and after touching a high of 1661 on 25th July started to decline against the US dollar coming down below the $1400 handle on 26th July.
We saw that after this decline, the prices started to stabilize above the $1350 handle, and then a pullback action was seen in the markets.
The prices started a bullish reversal which continues pushing the prices of Ethereum above the $1600 handle in the European trading session today.
We can clearly see a bullish engulfing pattern above the $1357 handle which is a bullish pattern and signifies the end of a bearish phase and the start of a bullish phase in the markets.
ETH is now trading just below its pivot level of 1622 and moving into a mildly bullish channel. The price of ETHUSD is now testing its classic resistance level of 1629 and Fibonacci resistance level of 1634 after which the path towards 1700 will get cleared.
The relative strength index is at 62 indicating a strong market and the continuation of the uptrend in the markets.
We can see the progression of a bullish ascending trendline formation from $1357 to $1690, which indicates that we are heading towards $1700.
Both the commodity channel index and highs/lows are indicating a neutral market.
Some of the technical indicators are giving a buy market signal.
Most of the moving averages are giving a buy signal, and we are now looking at the levels of $1700 to $1850 in the short-term range.
ETH is now trading above both its 100 hourly simple and exponential moving averages.
- Ether: a bullish reversal seen above the $1357 mark
- Short-term range appears to be mildly bullish
- ETH continues to remain above $1600
- The average true range is indicating less market volatility
Ether: Bullish Reversal Seen Above $1357
ETHUSD is now moving into a mildly bullish channel with the prices trading above the $1600 handle in the European trading session today.
We have also detected the formation of MA5 and MA10 crossover patterns located at 1630 and 1632 in the hourly time frame indicating that the price is likely to descend below after touching these levels in the short-term range.
We can see that the prices of Ethereum are slowly preparing for moving into a consolidation channel above the $1600 handle.
We can also see the formation of a bullish harami pattern in the 2-hour time frame indicating the bullish nature of the markets.
We can also witness the parabolic SAR bullish reversal in the daily timeframe, so the immediate targets visible now are $1650.
The key support levels to watch are $1500 and $1584, and the prices of ETHUSD need to remain above these levels for the continuation of the bullish trend.
ETH has increased by 10.64% with a price change of 155$ in the past 24hrs and has a trading volume of 25.107 billion USD.
We can see an increase of 43.29% in the total trading volume in the last 24 hrs which is due to the buying seen at lower levels.
The Week Ahead
We can see that ETH is now making attempts to clear the resistance zone located at $1650, and with the continued bullish tendency, we are now heading towards the $1700 level.
The price of Ethereum is preparing to enter into a consolidation phase above the $1600 levels and we can see some range-bounded movements between the $1500 and $1700 levels this week.
The immediate short-term outlook for Ether has turned mildly bullish, the medium-term outlook has turned neutral, and the long-term outlook for Ether is neutral in present market conditions.
The prices of ETHUSD will need to remain above the important support levels of $1500 this week.
The weekly outlook is projected at $1750 with a consolidation zone of $1600.
Technical Indicators:
The relative strength index (14): at 62.09 indicating a BUY
The moving averages convergence divergence (12,26): at 41.18 indicating a BUY
The rate of price change: at 1.92 indicating a BUY
Bull/Bear power(13): at 23.28 indicating a BUY
LTCUSD: Inverted Hammer Pattern Above $51
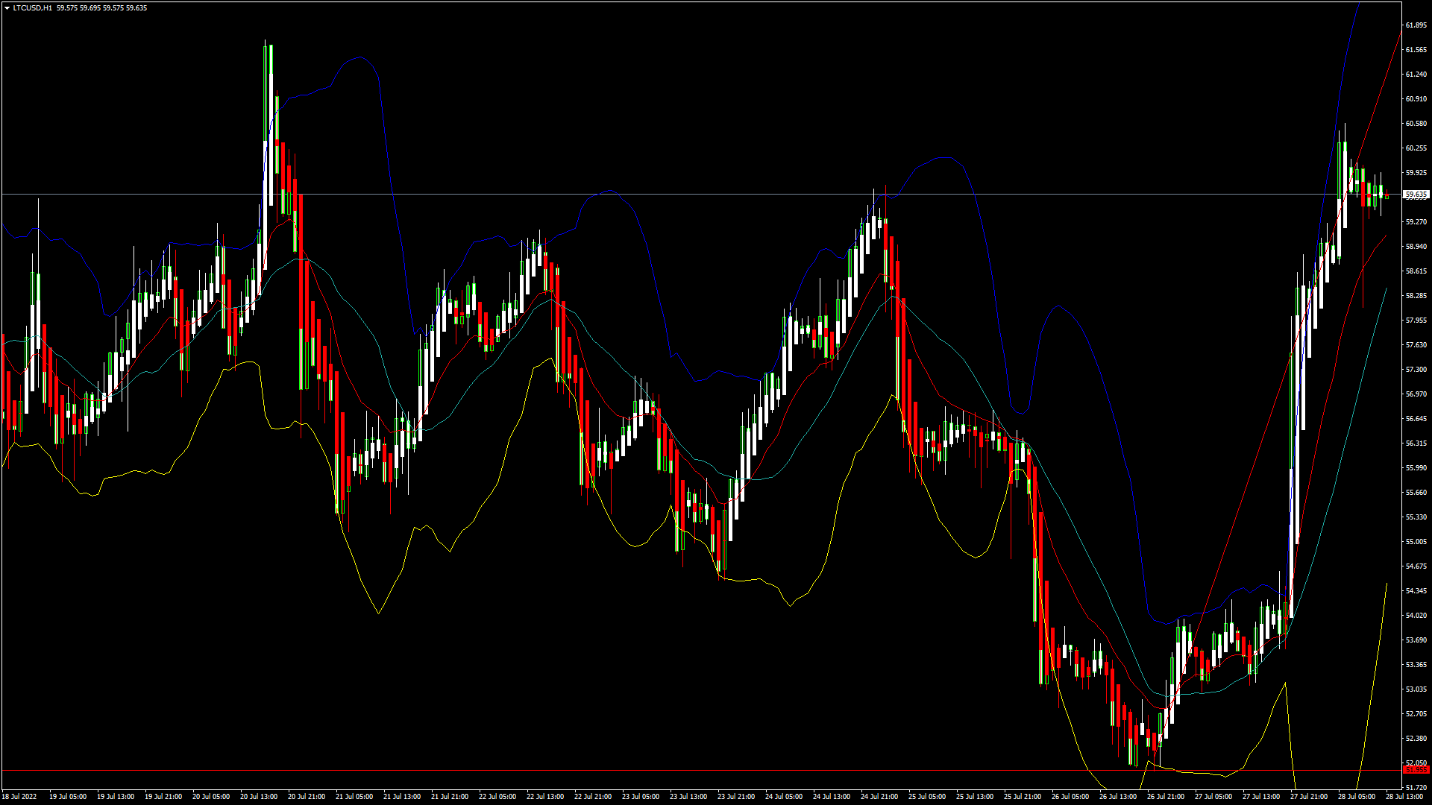
Litecoin was unable to sustain its bullish momentum last week and after touching a high of $59 on 25th July started to decline against the US dollar touching a low of $52 on 26th July.
We can see that after this decline, the prices of Litecoin have entered a bullish channel which continues today pushing it above the $59 handle.
We can clearly see an inverted hammer pattern above the 51 handle which is a bullish pattern and signifies the end of a bearish phase and the start of a bullish phase.
Litecoin is now trading above its 100 hourly simple moving averages and 100 hourly exponential moving averages. The price of LTCUSD is just above its pivot levels of 56.65.
The relative strength Index is at 68 indicating a strong market, and the continuation of the uptrend in the markets.
Litecoin touched an intraday high of $60 and an intraday low of $58 in the Asian trading session today.
The price of Litecoin continues to remain above most of the moving averages, some of which are now giving a buy signal at current market levels of 59.64.
The STOCHRSI is indicating an oversold level, which means that the prices are due to correct upwards in the short-term range.
The short-term outlook for Litecoin has turned mildly bullish.
- Most of the technical indicators are giving a strong buy signal
- Litecoin: a bullish reversal seen above the $56 levels
- The commodity channel index is indicating a neutral level
- The average true range is indicating less market volatility
Litecoin: Bullish Reversal Seen Above $51
We can see that the price of Litecoin continues to remain in the consolidation phase and is trading above the $59 handle in the European trading session today.
We can see the formation of a bullish trendline with a continued progression from $51 towards the $61 level.
The price of LTCUSD is now facing its classic resistance level of 59.88 and Fibonacci resistance level of 60.16 after which the path towards $65 will get cleared.
Litecoin’s price continues to gain traction against the US dollar as many medium-term investors are buying due to improving global sentiments.
We have also detected the formation of a bullish harami pattern in the 2-hour time frame indicating the bullish nature of the markets.
The daily RSI is printing at 58 which is indicating a strong market and the continuation of the bullish phase in the short-term range.
LTC has increased 11.48% with a price change of 6.15$ in the past 24hrs and has a trading volume of 0.618 billion USD.
Litecoin’s trading volume has increased by 58.53% as compared to yesterday which is due to the buying seen at lower levels by the medium-term investors.
The Week Ahead
We can see that Litecoin is on its way to clear its resistance zone located at $65 and now we are heading towards the $65 levels.
If the buying pressure continues then we can see a linear progression of this uptrend towards the $61 and $65 levels.
The prices of Litecoin need to remain above the $55 handle for the continuation of this bullish trend.
The short-term outlook for Litecoin has turned mildly bullish, the medium-term outlook is neutral, and the long-term outlook is neutral at present market conditions.
The weekly outlook is projected at $65 with a consolidation zone of $60.
Technical Indicators:
The relative strength index (14 days): at 68 indicating a BUY
The moving averages convergence divergence (12,26): at 1.32 indicating a BUY
The rate of price change: at 2.21 indicating a BUY
Bull/Bear power (13): at 1.29 indicating a BUY
FXOpen offers the world's most popular cryptocurrency CFDs*, including Bitcoin and Ethereum. Floating spreads, 1:2 leverage — at your service (additional fees may apply). Open your trading account now or learn more about crypto CFD trading with FXOpen.
*Important: At FXOpen UK, Cryptocurrency trading via CFDs is only available to our Professional clients. They are not available for trading by Retail clients. To find out more information about how this may affect you, please get in touch with our team.
This article represents the opinion of the Companies operating under the FXOpen brand only. It is not to be construed as an offer, solicitation, or recommendation with respect to products and services provided by the Companies operating under the FXOpen brand, nor is it to be considered financial advice.
Stay ahead of the market!
Subscribe now to our mailing list and receive the latest market news and insights delivered directly to your inbox.


Latest articles

AUD/CAD: Months of Indecision — Is a Breakout Finally Coming?
The Australian dollar has clawed back most of its end-of-June losses, when it touched three-month lows against the greenback amid escalating Middle East tensions. Since then, sentiment has improved: the RBA's Assistant Governor Sarah Hunter signalled the board stands ready

USD/JPY: Battling at the Top of the Triangle
On 3 July, Japan's Finance Minister, Satsuki Katayama, stated that the Ministry of Finance remains in close contact with US authorities regarding developments in USD/JPY as the yen traded near its weakest level in almost 40 years. Similar verbal

Dow Jones (DJIA): Consolidation Beyond the Trend
Federal Reserve Chair Kevin Warsh testified before Congress on 14–15 July, reaffirming the Fed's commitment to bringing inflation back to target while providing no clear guidance on the future path of interest rates. Meanwhile, June inflation data came in