


ETHUSD and LTCUSD Technical Analysis – 29th DEC, 2022
FXOpen
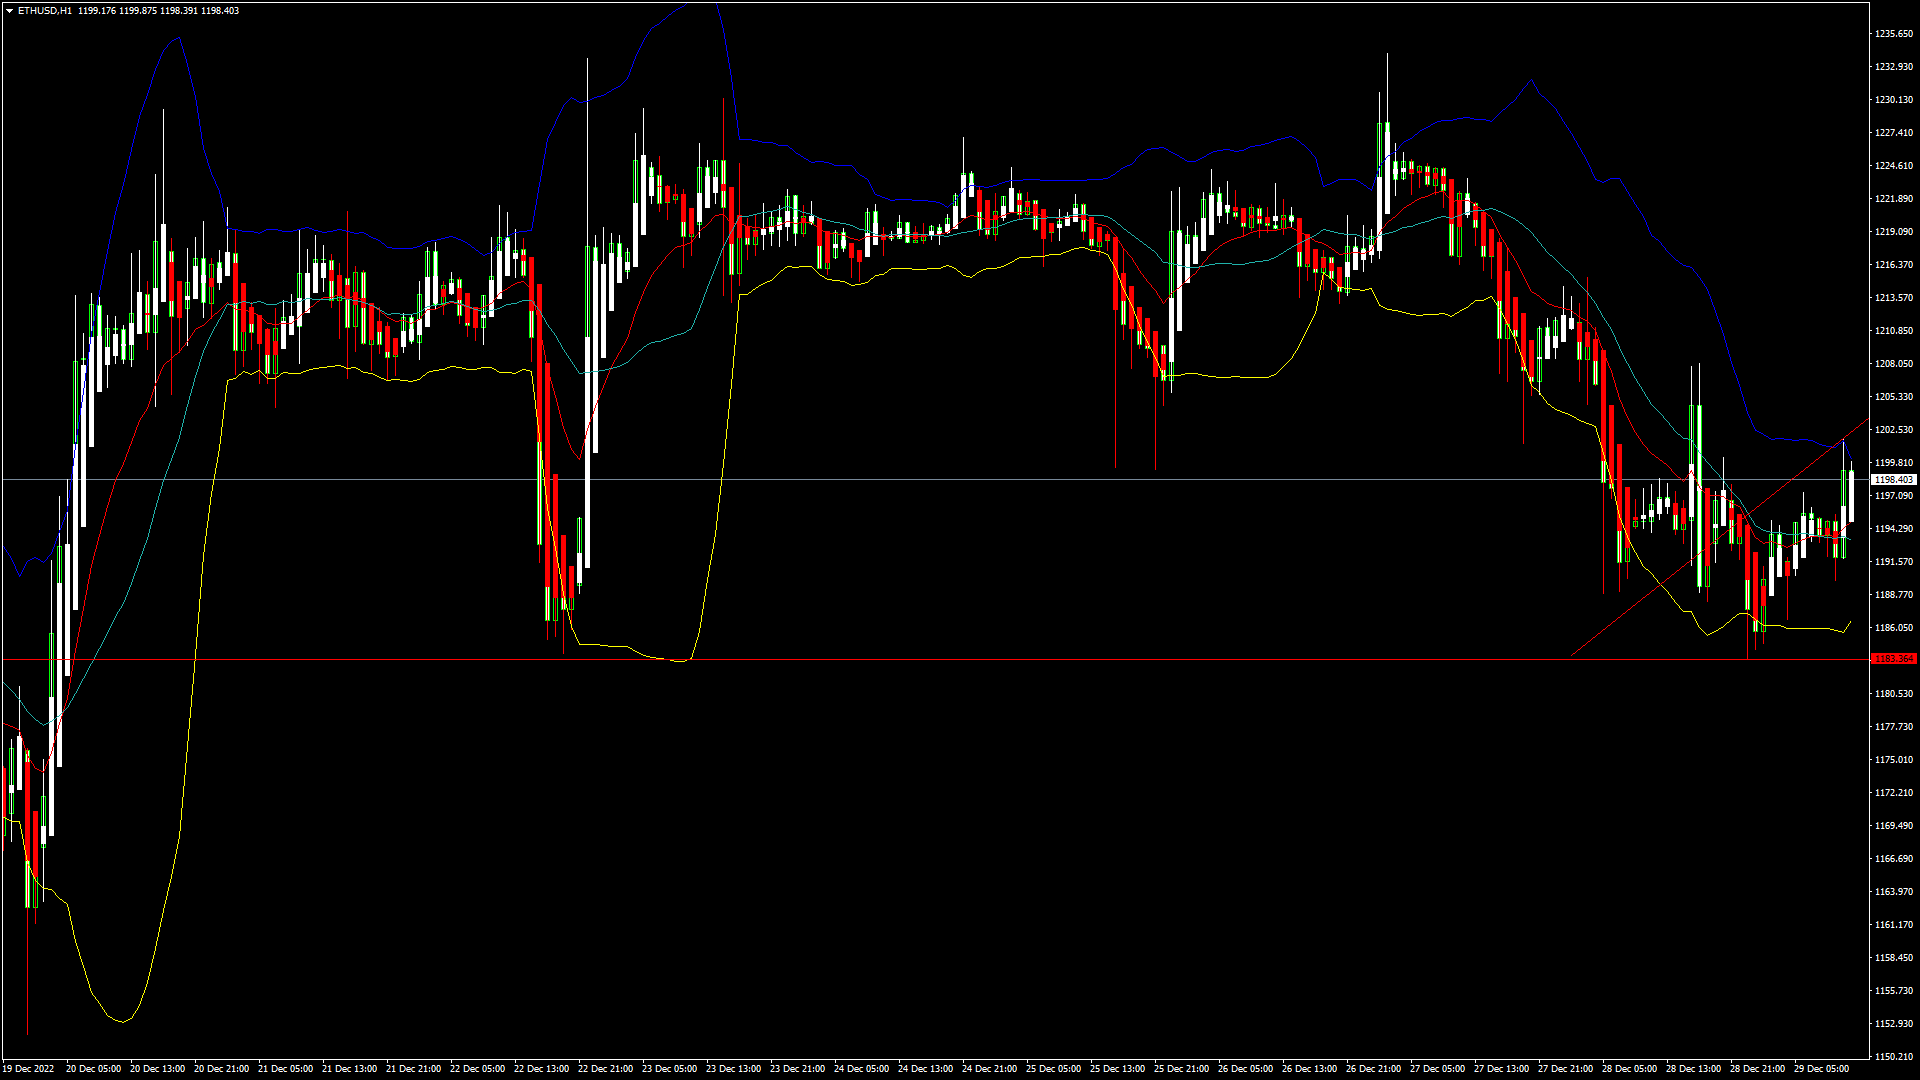
ETHUSD: Double Bottom Pattern Above $1183
Ethereum was unable to sustain its bearish momentum and after touching a low of 1185 on 22nd Dec, the price started to correct upwards against the US dollar moving into a consolidation channel above the $1200 handle on 27th Dec.
The prices are ranging near the support of the channel in the 15-minute time frame indicating a bullish trend.
We can clearly see a double bottom pattern above the $1183 handle which is a bullish pattern and signifies the end of a bearish phase and the start of a bullish phase in the markets.
ETH is now trading just above its pivot level of 1197 and moving into a consolidation channel. The price of ETHUSD is now testing its classic resistance level of 1202 and Fibonacci resistance level of 1206 after which the path towards 1300 will get cleared.
The relative strength index is at 53 indicating a NEUTRAL demand for Ether and the continuation of the consolidation phase in the markets.
Both the STOCHRSI and Williams percent range are indicating an OVERBOUGHT level, which means that the price is expected to decline in the short-term range.
Some of the technical indicators are giving a BUY market signal.
Most of the moving averages are giving a NEUTRAL signal due to the market consolidation seen below the $1250 handle.
ETH is now trading below its 100 hourly simple and 200 hourly exponential moving averages.
- Ether: bullish reversal seen above the $1183 mark
- The short-term range appears to be mildly bullish
- ETH continues to remain above the $1150 level
- The average true range is indicating LESS market volatility
Ether: Bullish Reversal Seen Above $1183
ETHUSD is now moving into a consolidation/correction channel with the price trading above the $1150 handle in the European trading session today.
We can see a range-bound movement in Ethereum from the last 15 days due to low liquidity and lower trading volumes.
The price of Ethereum has failed to clear the resistance of $1300 after touching a low of $1159 on 17th Dec.
ETHUSD touched an intraday low of 1184 in the Asian trading session and an intraday high of 1200 in the European trading session today.
We have seen a bullish opening in the markets this week.
The daily RSI is printing at 44 indicating a weak demand for Ether in the long-term range.
The key support levels to watch are $1152 which is a 1-month low, and $1183 which is a 3-10 day MACD oscillator stalls.
ETH has increased by 0.04% with a price change of 0.442$ in the past 24hrs and has a trading volume of 4.723 billion USD.
We can see an increase of 4.27% in the total trading volume in the last 24 hrs which appears to be normal.
The Week Ahead
ETH’s price started a minor correction above the $1200 handle and is now facing hurdles crossing the $1250 range on the upside.
The immediate short-term outlook for Ether has turned mildly bullish, the medium-term outlook has turned neutral, and the long-term outlook for Ether is neutral in present market conditions.
The price of ETHUSD will need to remain above the important support level of $1197 which is the pivot point.
The resistance zone is located at $1227 which is a 38.2% retracement from a 4-week low and at $1265 at which the price crosses 9-day moving average stalls.
The weekly outlook is projected at $1250 with a consolidation zone of $1200.
Technical Indicators:
The STOCH (9,6): is at 66.34 indicating a BUY
The commodity channel index (14): is at 162.66 indicating a BUY
High/lows (14): is at 4.04 indicating a BUY
Bull/bear power (13): is at 7.87 indicating a BUY
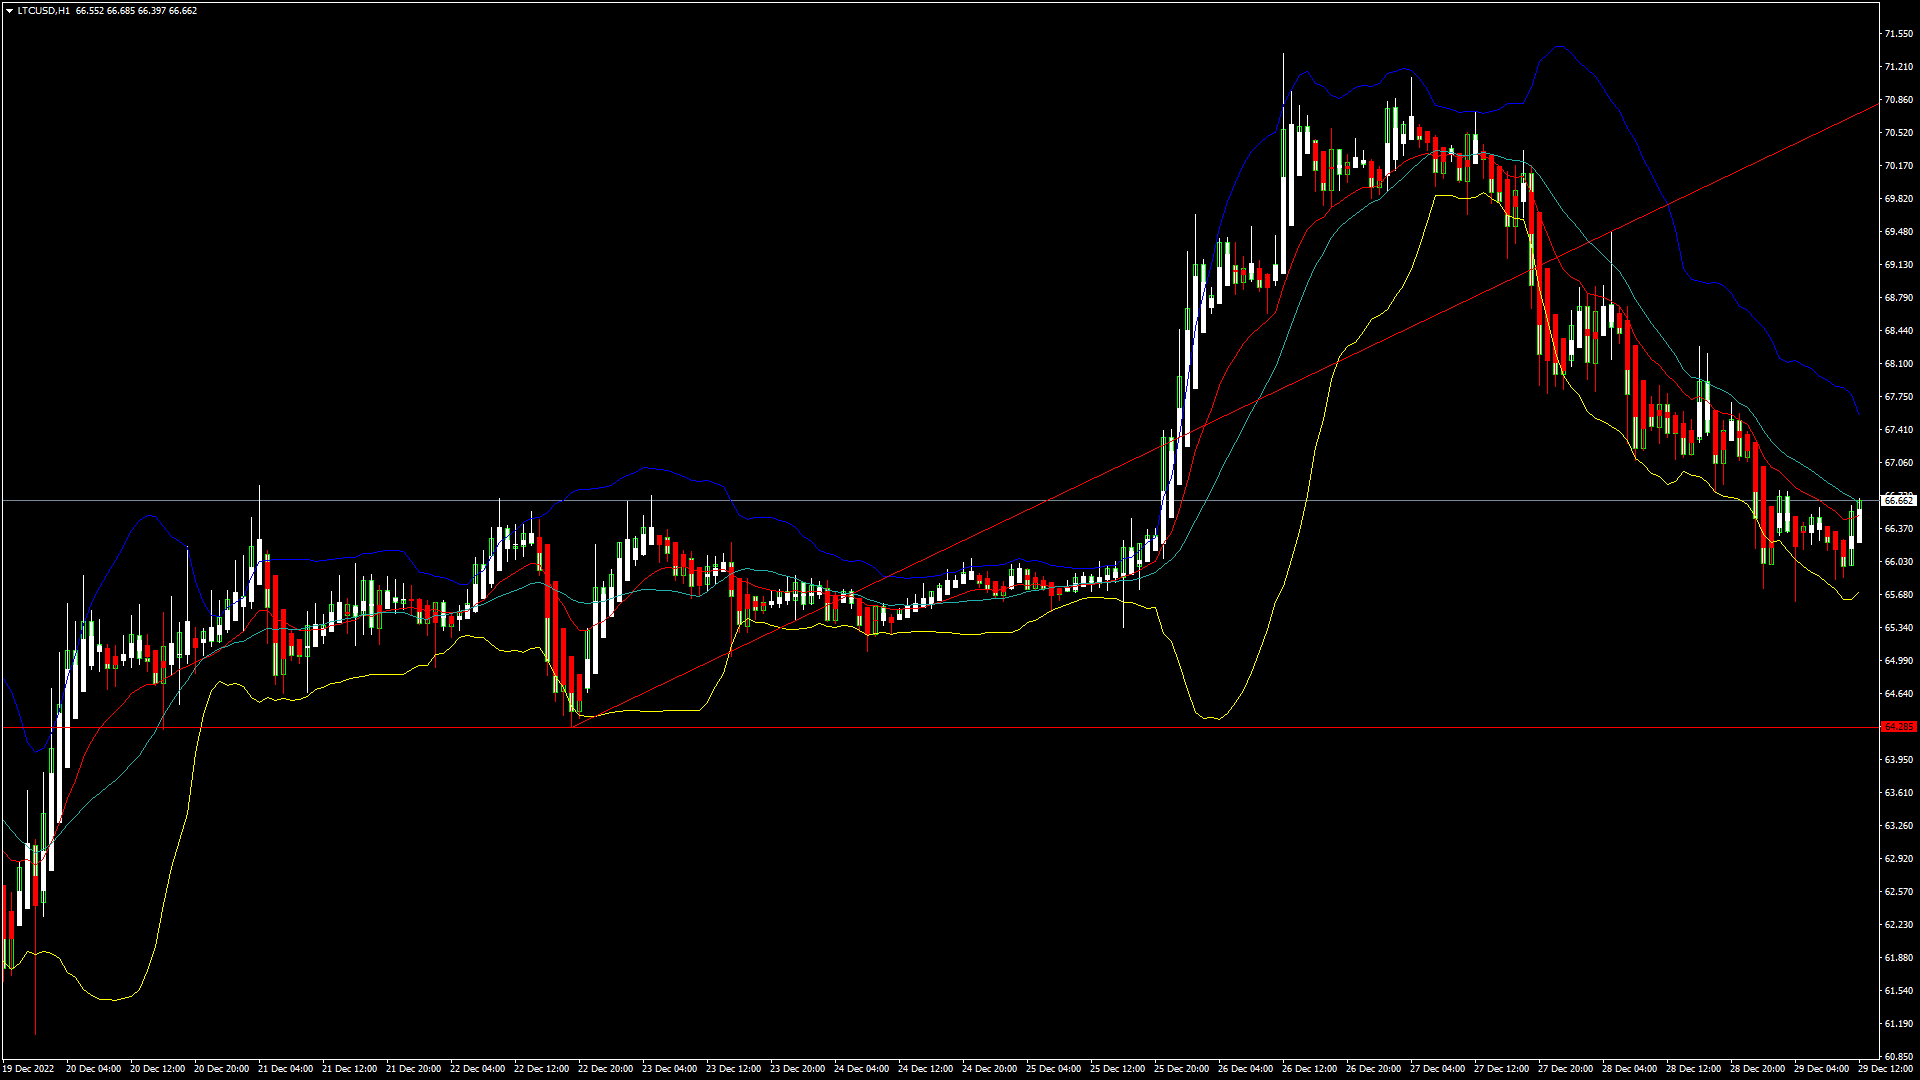
LTCUSD: Three White Soldiers Pattern Above $64.28
Litecoin was unable to sustain its bearish momentum last week and after touching a low of $64.28 on 22nd Dec, the prices started to move upwards against the US dollar touching a high of $71.08 on 27th Dec.
The price of Litecoin has corrected lower below the $71 handle due to short selling, and decrease in the market liquidity.
We can clearly see a three white soldiers pattern above the $64.28 handle which is a bullish pattern and signifies the end of a bearish phase and the start of a bullish phase in the markets.
Litecoin is now trading below its 100 hourly simple moving average and below its 200 hourly simple moving average. The price of LTCUSD is just above its pivot level of 66.36.
The relative strength index is at 45.21 indicating a NEUTRAL demand for Litecoin and the shift towards the consolidation phase in the markets.
Litecoin touched an intraday high of $66.75 and an intraday low of $65.62 in the Asian trading session today.
The price of Litecoin continues to remain above some of the moving averages, which are now giving a BUY signal at current market levels of 66.63
The RSI is indicating a neutral level, which means that the price is expected to move towards the consolidation phase in the short-term range.
The short-term outlook for Litecoin has turned mildly bullish.
- Some of the technical Indicators are giving a buy signal
- Litecoin: bullish reversal seen above the $64.28 level
- The STOCHRSI is giving an OVERBOUGHT signal
- The average true range is indicating LESS market volatility
Litecoin: Bullish Reversal Seen Above $64.28
The price of Litecoin is now moving in a zigzag pattern within a narrow range and continues to bounce upwards after a decline in its levels below the $65 handle.
The price is ranging near the horizontal support in both the 15-minute and 1-hour time frames indicating a bullish trend.
The price of LTCUSD is now facing its classic resistance level of 66.76 and Fibonacci resistance level of 66.97 after which the path towards $70 will get cleared.
Litecoin is now facing its resistance zone at $70.44 which is a 14-3 day raw stochastic at 50% and at $72.63 at which the price crosses 9-day moving average stalls.
The daily RSI is printing at 43.92 which is indicating a weak demand for Litecoin and the continuation of the consolidation wave in the medium-term range.
LTCUSD has decreased by 1.17% with a price change of 0.7915$ in the past 24hrs and has a trading volume of 0.385 billion USD.
Litecoin’s trading volume has decreased by 20.67% compared to yesterday which appears to be normal.
The Week Ahead
The price of Litecoin has failed to clear the resistance of $72, and now we are looking for a fresh upside wave after the current phase of market consolidation gets over.
Due to the end of the year, the trading volumes remain thin and many long-term investors are not coming into the markets.
Some of the technical indicators are also giving a neutral stance.
The price of Litecoin needs to remain above the important support level of $66.14 which is a 50% retracement from a 13-week high/low.
The short-term outlook for Litecoin has turned mildly bullish, the medium-term outlook is neutral, and the long-term outlook is neutral at present market conditions.
The weekly outlook is projected at $70 with a consolidation zone of $68.
Technical Indicators:
The STOCH (9,6): is at 62.19 indicating a BUY
The Williams percent range: is at -39.02 indicating a BUY
The ultimate oscillator: is at 65.14 indicating a BUY
The commodity channel index (14): is at 64.93 indicating a BUY
FXOpen offers the world's most popular cryptocurrency CFDs*, including Bitcoin and Ethereum. Floating spreads, 1:2 leverage — at your service (additional fees may apply). Open your trading account now or learn more about crypto CFD trading with FXOpen.
*Important: At FXOpen UK, Cryptocurrency trading via CFDs is only available to our Professional clients. They are not available for trading by Retail clients. To find out more information about how this may affect you, please get in touch with our team.
This article represents the opinion of the Companies operating under the FXOpen brand only. It is not to be construed as an offer, solicitation, or recommendation with respect to products and services provided by the Companies operating under the FXOpen brand, nor is it to be considered financial advice.
Stay ahead of the market!
Subscribe now to our mailing list and receive the latest market news and insights delivered directly to your inbox.


Latest articles

AI Valuations Are Back in the Spotlight
Artificial intelligence remains the dominant investment theme of 2026, but investors are increasingly questioning whether AI stock valuations are keeping pace with reality.
💰 Big Tech continues to invest at an unprecedented scale, with hyperscaler AI spending projected to exceed $800

AUD/CAD: Months of Indecision — Is a Breakout Finally Coming?
The Australian dollar has clawed back most of its end-of-June losses, when it touched three-month lows against the greenback amid escalating Middle East tensions. Since then, sentiment has improved: the RBA's Assistant Governor Sarah Hunter signalled the board stands ready

USD/JPY: Battling at the Top of the Triangle
On 3 July, Japan's Finance Minister, Satsuki Katayama, stated that the Ministry of Finance remains in close contact with US authorities regarding developments in USD/JPY as the yen traded near its weakest level in almost 40 years. Similar verbal