Failed Breakout for ETH, Dash Up
FXOpen

Both of the cryptos we follow on Thursdays are up compared to seven days ago. But only Dash in still in rally mode.
Failed Breakout for ETH/BTC
Ether had a brief break above the upper end of the range at 0.05545 BTC. A high of 0.05906 BTC was seen on November 25th but prices topped out here. We are currently trading much lower at 0.0435 BTC per coin.
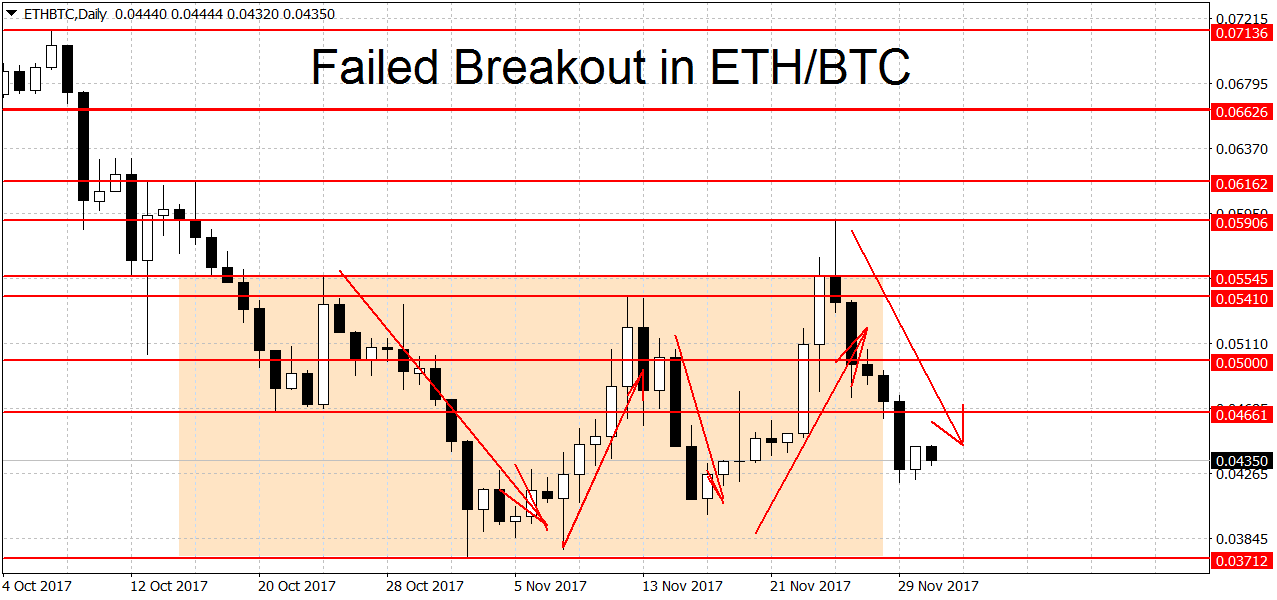
After that failed breakout ETH prices are back in a range. The threshold to start a new rally has now moved to 0.05906 BTC. On the lower end the bears need to push ETH/BTC below the 0.03712 lows to start a new downtrend. On the longer-term charts the picture is mixed. On the weekly charts prices are looking bearish but on the monthly the situation is reversed, with ETH still in an uptrend.
Dash in Rally Mode
Dash is still in a rally vs bitcoin while most altcoins continue to lose ground. We are quoted at 0.07715 right now, up by close to 13 percent since last Thursday. The bears now need a move below the 0.0576 BTC swing low to end the current uptrend. A breakdown below the 0.05 round figure would start a new downtrend in prices.
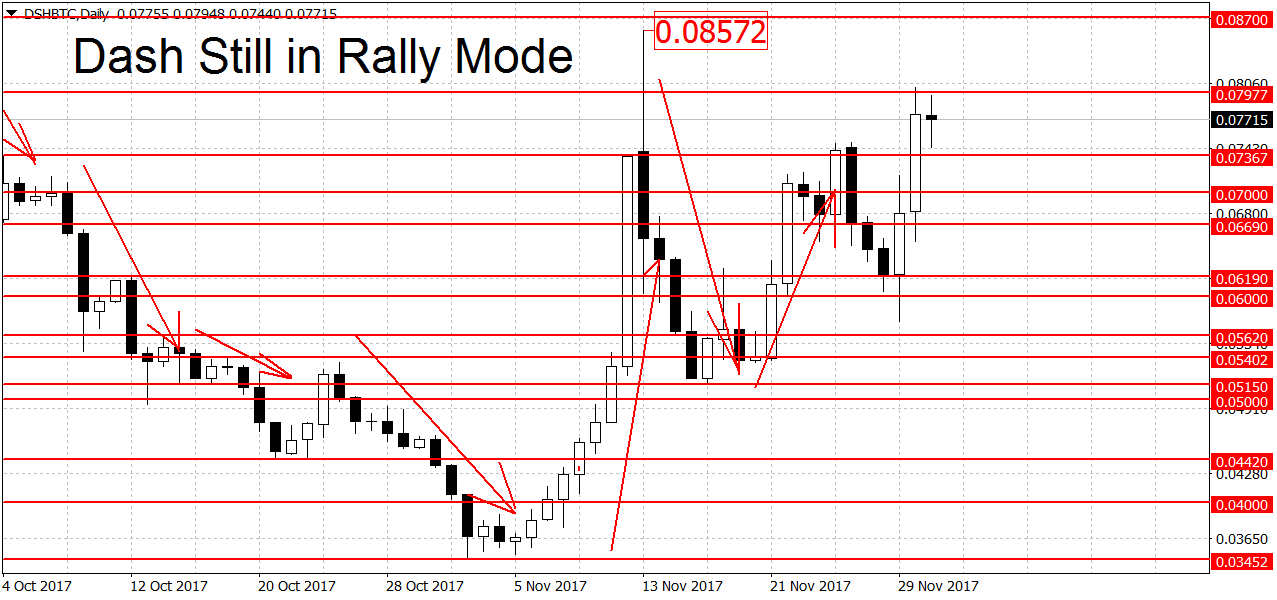
Support above here can be found at the 0.0515 swing low. This is followed by the former highs at 0.05402 BTC, 0.0562 BTC and the 0.06 round figure. Above current prices, we have a double top resistance around the 0.08 round level. Prices topped out here yesterday at 0.08018 BTC per coin. Higher up we find more resistance at last month’s spike high of 0.08572 BTC, followed by the 8-month high at 0.0972 BTC.
Not far from here we have the 0.1 round figure that could also act as resistance. The all-time high for DSH/BTC was set back in March at 0.1265 BTC. It should act as strong resistance if prices were to get that high. On the longer-term charts Dash is range-bound on the weekly but bullish on the monthlies.
Bitcoin Drops 23 Percent
No crypto update is complete without taking at look at big brother bitcoin. Bitcoin is down close to 23 percent versus the U.S. Dollar. Prices peaked out at $11,427 two days ago and have since swung back and forth around the $10,000 mark.
Despite the large retracement, BTC/USD remains in an uptrend on the daily charts. To end it the bears need to push the pair below the $7,769 swing low. On the weekly and monthly charts bitcoin is in rally mode as well.
Altcoin trading with FXOpen – one of the largest crypto currency brokers
FXOpen offers the world's most popular cryptocurrency CFDs*, including Bitcoin and Ethereum. Floating spreads, 1:2 leverage — at your service (additional fees may apply). Open your trading account now or learn more about crypto CFD trading with FXOpen.
*Important: At FXOpen UK, Cryptocurrency trading via CFDs is only available to our Professional clients. They are not available for trading by Retail clients. To find out more information about how this may affect you, please get in touch with our team.
This article represents the opinion of the Companies operating under the FXOpen brand only. It is not to be construed as an offer, solicitation, or recommendation with respect to products and services provided by the Companies operating under the FXOpen brand, nor is it to be considered financial advice.
Stay ahead of the market!
Subscribe now to our mailing list and receive the latest market news and insights delivered directly to your inbox.


Latest articles


Australian Dollar Loses Momentum After May Peaks
Fundamental Background
The RBA’s third consecutive interest rate increase to 4.35% reflects the regulator’s concern over rising inflation: the conflict in the Middle East is increasing energy costs and putting upward pressure on prices. Annual consumer inflation