


Five of the Best Volume Indicators
FXOpen
Understanding volume and volume indicators is crucial for anyone looking to understand the financial markets. This article offers traders insights into the five of the best volume indicators, allowing them to gauge market trends, momentum, and potential reversals.
Understanding Volume and Volume Indicators in Trading
In trading, volume refers to the quantity of a financial instrument, such as shares or contracts, that are bought and sold within a specified time frame. Often displayed as a bar graph beneath the price chart, volume shows traders the strength or weakness of price movements. A surge in volume generally indicates strong interest, which can validate a trend, while low volume might signify a lack of conviction or impending reversal.
Volume indicators are computational tools designed to assess volume data. They work alongside traditional price indicators to offer a fuller understanding of market behaviour. They can help traders identify changes in momentum and shifts in market sentiment, acting as a secondary measure to confirm signals from price action.
Best Volume Indicators List
With an understanding of how volume works and why it’s important, let’s take a closer look at the list of volume indicators favoured by traders.
To gain the best understanding of how these volume technical indicators work, head over to FXOpen’s free TickTrader platform. There, you’ll find each indicator described waiting for you.
On-Balance Volume (OBV)
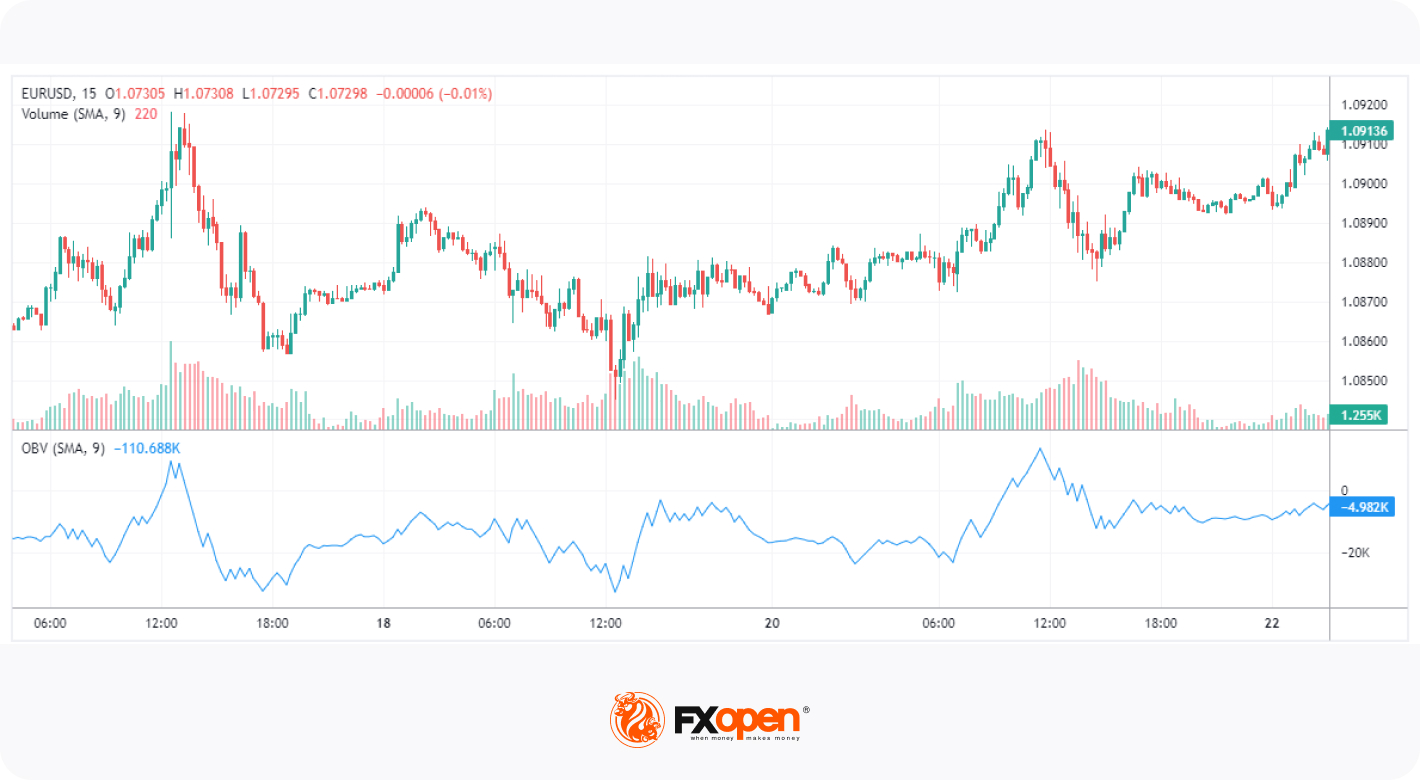
On-Balance Volume (OBV) is a powerful tool that gives traders a cumulative measure of buying and selling activity in a financial asset. Originating from the idea that volume precedes price movements, the OBV adds the period’s trading volume to a running total when the asset closes higher than the previous period and subtracts it when the asset closes lower. This running total serves as a way to quantify the force or pressure of buyers and sellers.
Traders use the OBV line, usually plotted below the price chart, to confirm trends and identify potential reversals. When the OBV line rises, it signifies dominant buying pressure, often reinforcing an upward trend in the asset's price. On the other hand, when the OBV line is in decline, it signals that selling pressure outweighs buying pressure, which may herald a downward trend. OBV divergences – when the OBV trend conflicts with the asset's price trend – are considered strong indicators of an impending reversal.
Accumulation/Distribution Line (A/D Line)
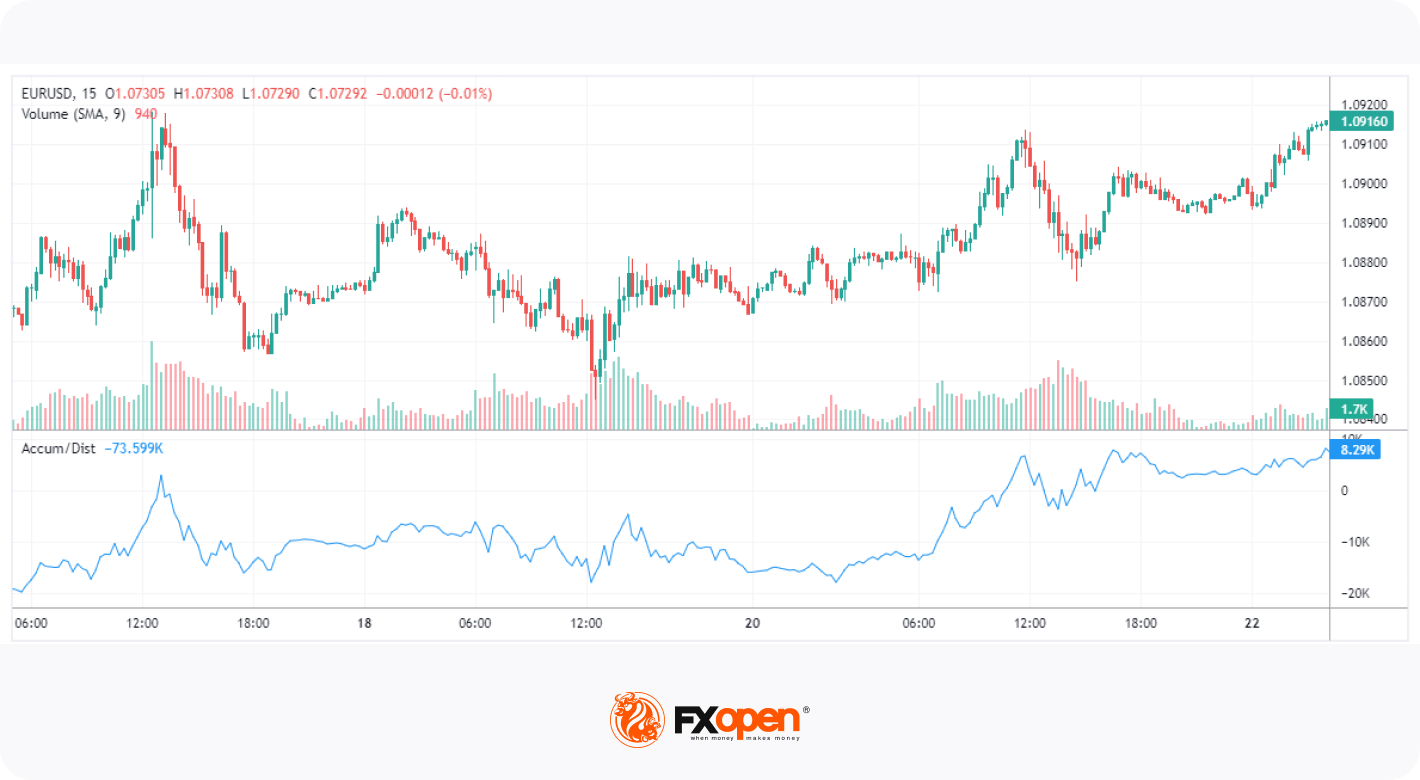
The Accumulation/Distribution Line (A/D Line) serves as a momentum indicator that tracks the flow of capital into or out of an asset by evaluating both price and volume. Unlike the On-Balance Volume, which uses daily up or down volume in its calculation, the A/D Line utilises the asset's closing price relative to its high-low range for the period, along with the period's volume. This results in a more nuanced representation of buying and selling pressure.
Traders often examine the trajectory of the A/D Line to confirm existing trends or to spot emerging ones. An ascending A/D Line typically suggests a buildup of buying pressure, supporting a bullish outlook. Similarly, a declining A/D Line indicates increased selling activity, pointing toward a bearish sentiment. The A/D Line is particularly useful when used in tandem with other indicators to strengthen trading signals.
Fixed Range Volume Profile
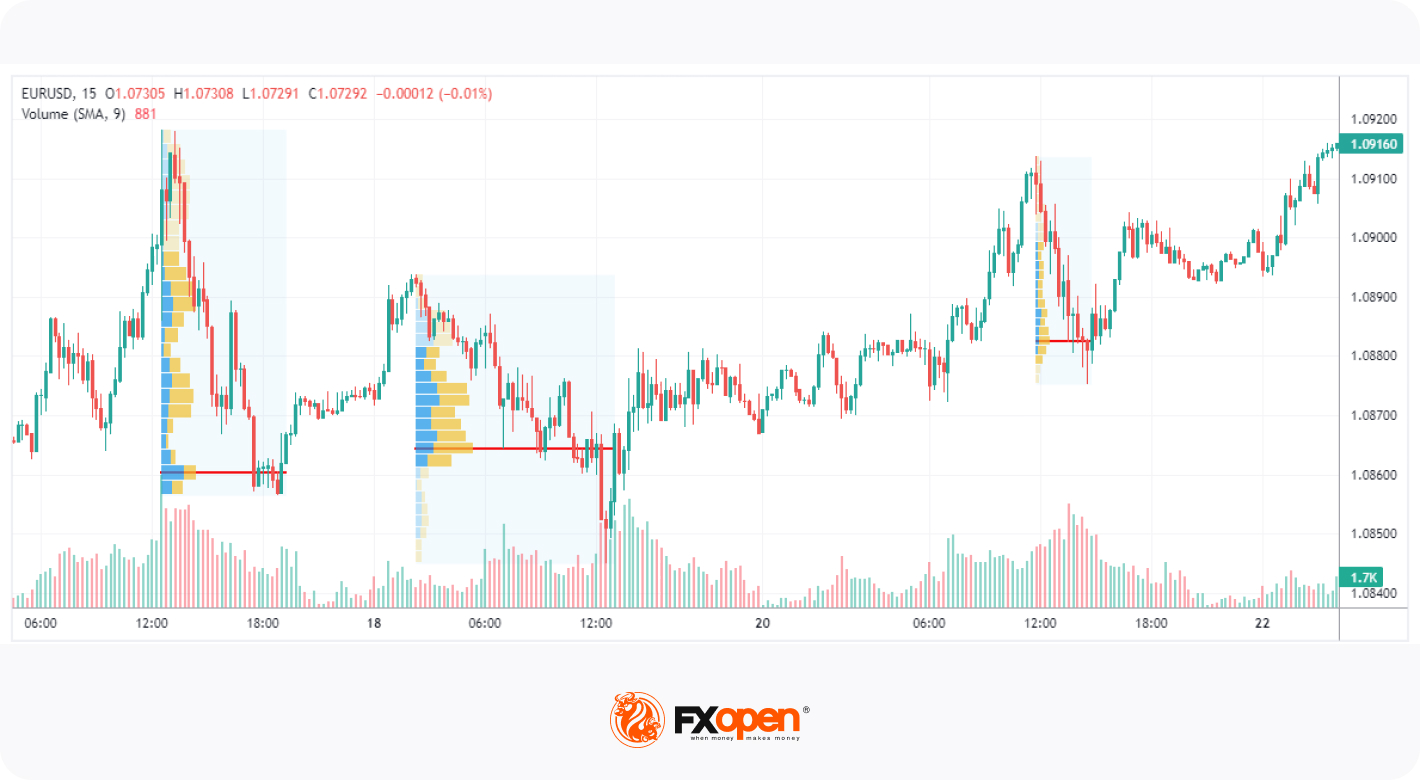
The Fixed Range Volume Profile is a unique volume indicator that plots volume on the vertical axis of a price chart rather than the traditional horizontal display. Unlike indicators like the On-Balance Volume or the Accumulation/Distribution Line, the Fixed Range Volume Profile focuses on identifying high-volume nodes over a specified price range, typically between key swing highs and lows. It showcases where the most trading activity has occurred and helps to highlight significant support and resistance levels.
Traders use this profile to understand where the majority of trading has taken place within a set range, often revealing "value areas" where price is most likely to trade. Fixed Range Volume Profile is particularly useful for spotting imbalances in supply and demand, making it a critical tool for assessing the potential strength or weakness of future price movements.
Chaikin Money Flow (CMF)
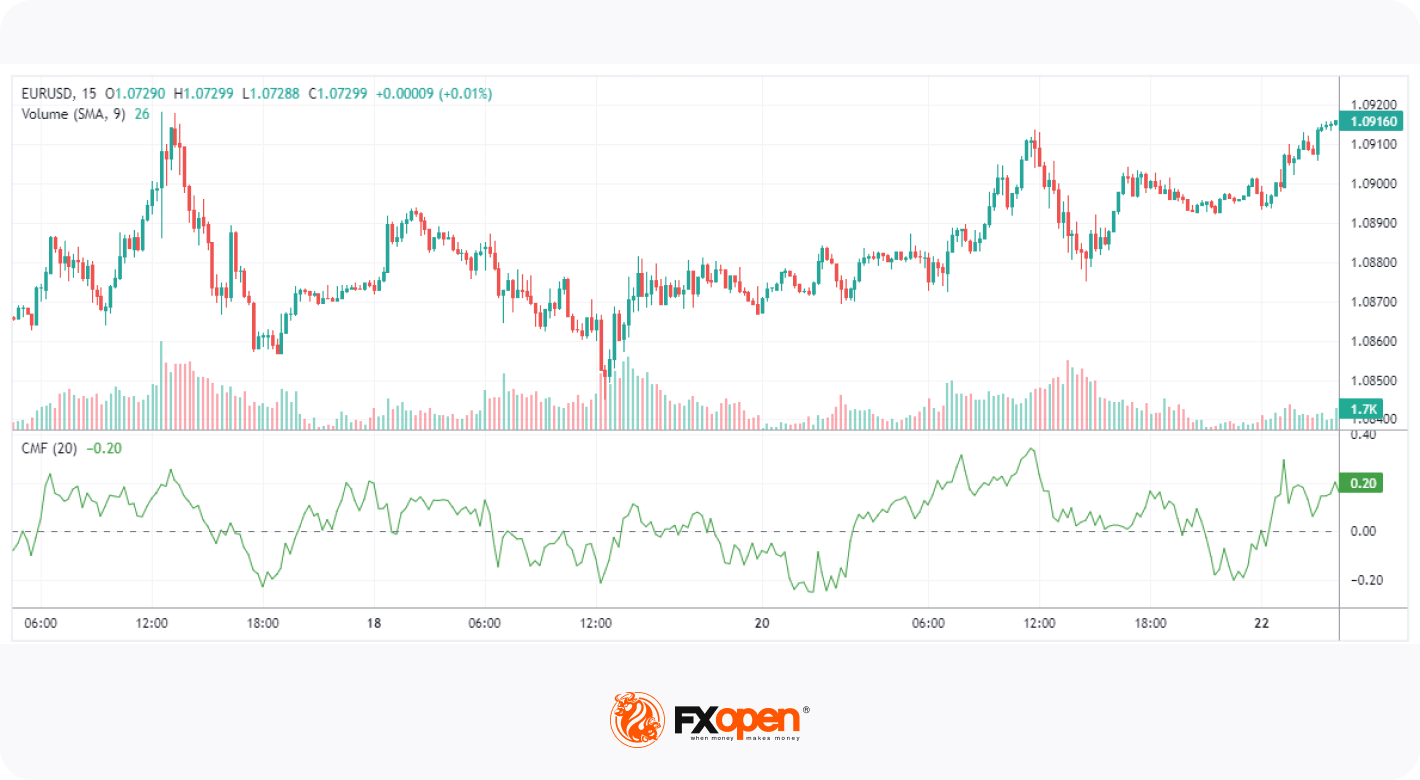
The Chaikin Money Flow (CMF) is a volume-weighted average oscillator that takes both price and volume into account to assess money flow over a specified period. The CMF provides a snapshot over a designated time frame, commonly 20 or 21 periods. The calculation involves summing Accumulation/Distribution values and dividing them by the total volume for the same duration.
Traders use CMF to discern short-term trends and money flow direction. A positive CMF value, hovering closer to 1, usually signals bullish sentiment, indicating that money is flowing into the asset. A negative CMF value, closer to -1, suggests a bearish sentiment and a potential outflow of capital. This makes CMF a strong tool for identifying potential breakouts or breakdowns.
Money Flow Index (MFI)
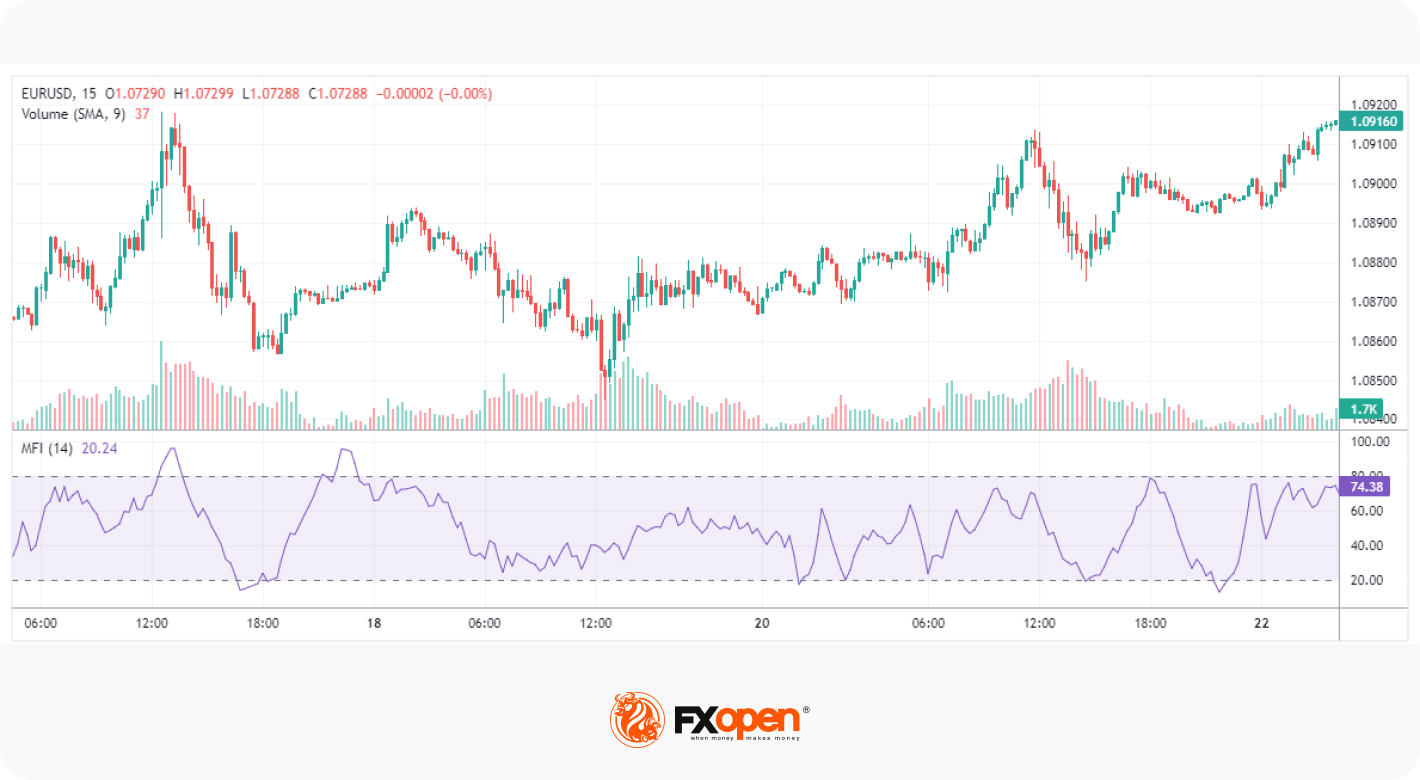
The Money Flow Index (MFI), considered one of the best volume indicators for day trading, is an oscillator that offers a quick glimpse into the buying and selling pressure on an asset. It combines both price and volume to create a more comprehensive view of market sentiment. The calculation involves a typical price for each period multiplied by the volume for that period, resulting in raw money flow. The index ranges from 0 to 100, providing clear overbought or oversold signals.
Traders often use MFI to detect market extremes. A reading above 80 signifies an overbought condition, suggesting a potential downturn. A reading below 20 indicates oversold conditions, often followed by a price uptick. MFI is also proficient in spotting divergences, serving as a useful tool for predicting reversals.
The Bottom Line
In closing, volume indicators can be indispensable for traders looking to capitalise on market trends and shifts in momentum. While there are many volume indicators to choose from, it’s worth experimenting with some to enhance your trading outcomes.
To experience the power of these tools in real-time, consider opening an FXOpen account. Once you do, you’ll gain access to hundreds of markets, competitive trading costs, and lightning-fast execution speeds. Good luck!
This article represents the opinion of the Companies operating under the FXOpen brand only. It is not to be construed as an offer, solicitation, or recommendation with respect to products and services provided by the Companies operating under the FXOpen brand, nor is it to be considered financial advice.
Stay ahead of the market!
Subscribe now to our mailing list and receive the latest market news and insights delivered directly to your inbox.


Latest articles

EUR/USD: All Eyes on the Fed as the Range Reaches Its Breaking Point
The dollar's next move hinges on tonight's Fed decision, and this time markets genuinely don't know what to expect. While economists still lean toward a hold—with CME FedWatch odds sitting near 68.5% for no change—Kevin Warsh's hawkish

USD/JPY and USD/CAD Test Resistance Ahead of Fresh Fed Signals
The US dollar continues to hold the upper hand against most major currencies ahead of the outcome of the latest Federal Reserve meeting. While the base-case scenario remains for interest rates to stay unchanged, markets are also pricing in the

Amazon Earnings: Does the Chart Already Know Something the Numbers Don't?
All eyes are on July 30, when Amazon reports Q2 2026 earnings, with Wall Street increasingly convinced the bar has been set too low. Consensus sees EPS near $1.82-$2.26 on roughly $197 billion in revenue, but the