


How to Use the Accumulation/Distribution Indicator
FXOpen
Learning how to identify accumulation and distribution in an asset is an important skill to have for any trader. Luckily, there’s a handy tool we can use: the aptly-named Accumulation/Distribution indicator.
In this article, we’ll show you how this accumulation/distribution indicator works, where it’s best applied, and how you can combine it with other tools to boost your odds of success.
What Is the Accumulation/Distribution Indicator?
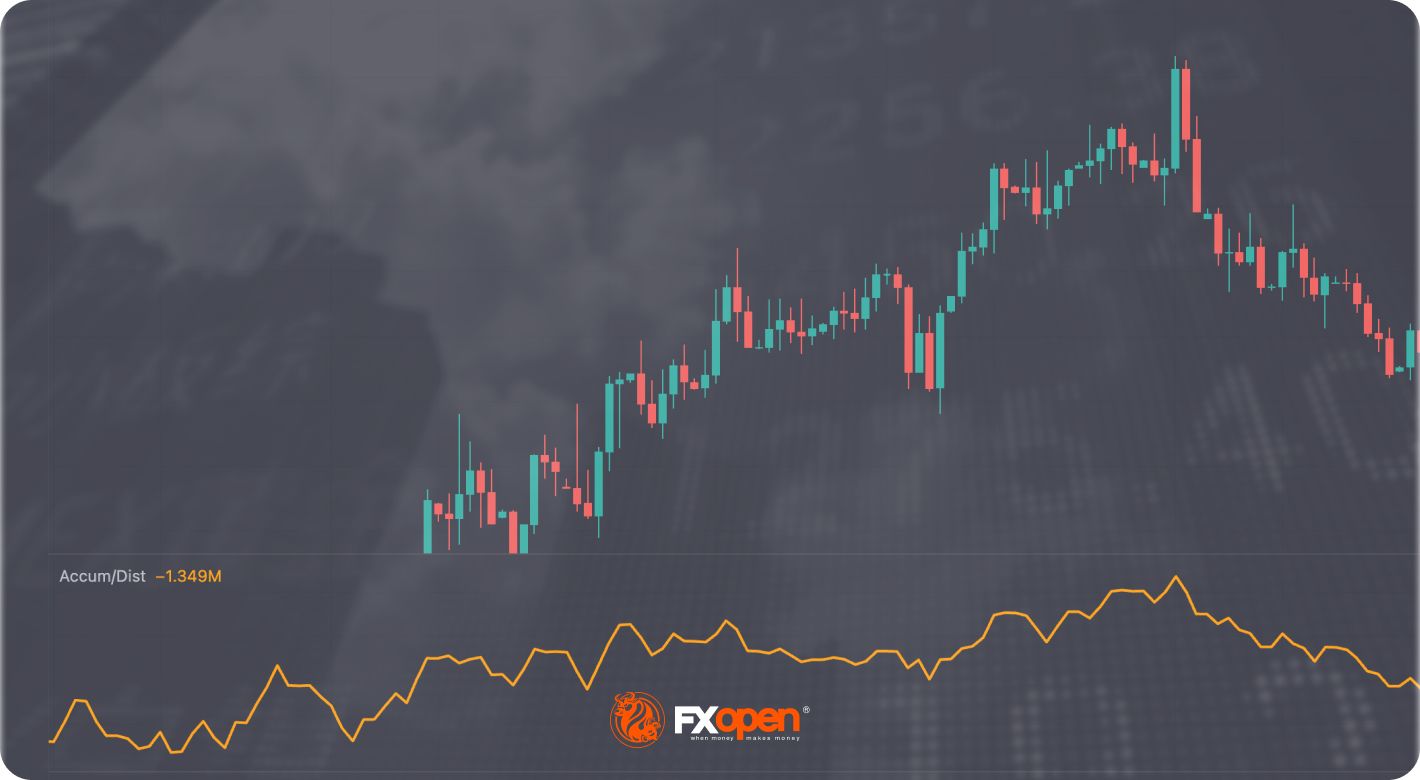
The accumulation/distribution indicator, also called the accumulation/distribution index, accumulation/distribution line, and abbreviated to A/D, is a cumulative indicator that uses price and volume data to measure the strength of an asset’s trend. It helps traders identify buying and selling pressure in the market and can show whether an asset is likely to continue trending or is due for a reversal. It was created by renowned trader Marc Chaikin, who also developed the famous Chaikin Money Flow indicator.
Accumulation vs Distribution
Accumulation occurs when buying pressure outweighs selling pressure, resulting in price appreciation. Conversely, distribution is where sellers have the upper hand over buyers, creating downward momentum. In practice, the plotted A/D line will move up when accumulation is present and down when distribution occurs.
Accumulation/Distribution Oscillator Formula and Components
The ADI seeks to quantify an asset's buying and selling pressure by considering its trading range and trading volume.
First, it calculates the Money Flow Multiplier (MFM) using the following formula:

This results in a reading between -1 and 1. When the price closes in the upper half of its high-low range, the MFM will be positive. If it closes in the lower half, then MFM will be negative. In other words, if buying pressure is strong, the MFM will rise, and vice versa.
Second, it generates the Money Flow Volume (MFV) with the following:
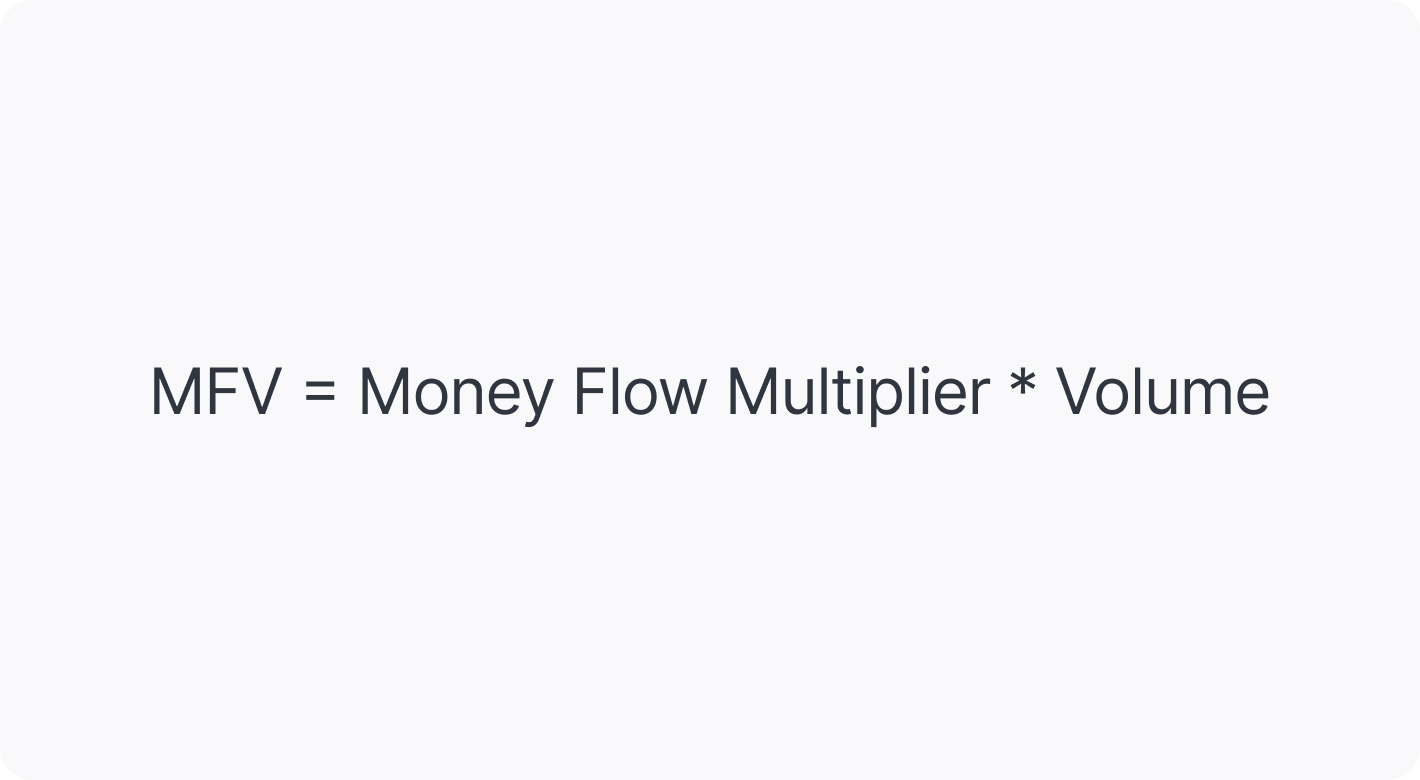
For the first candle in a given chart, the MFV is the first A/D value. Since the indicator is cumulative, the MFV is added to the previous A/D value. In essence:
First Calculation = (ADI = MFV)
Subsequent Calculations = (ADI + MFV)
This then creates the A/D line. While it may seem unnecessary to know the formula, it can provide us with significant insight into how an accumulation/distribution rating is given. For example, a strong bullish trend may cause an asset to close high in its trading range, producing an MFM reading close to 1. If this is backed up by high volume, the A/D line will surge upward. However, if the volume is lacking, then the A/D may only increase slightly.
Thankfully, we don’t need to perform this calculation ourselves. With the free TickTrader platform we offer at FXOpen, you’ll find the accumulation/distribution indicator and dozens of other tools ready to help you navigate the markets.
How to Use the Accumulation Distribution Indicator
There are three popular ways to use the A/D indicator: identifying reversals, trend confirmation, and trading breakouts.
Identifying Reversals
One of the most effective uses of A/D is to spot potential reversals using divergences between the price and the A/D line.
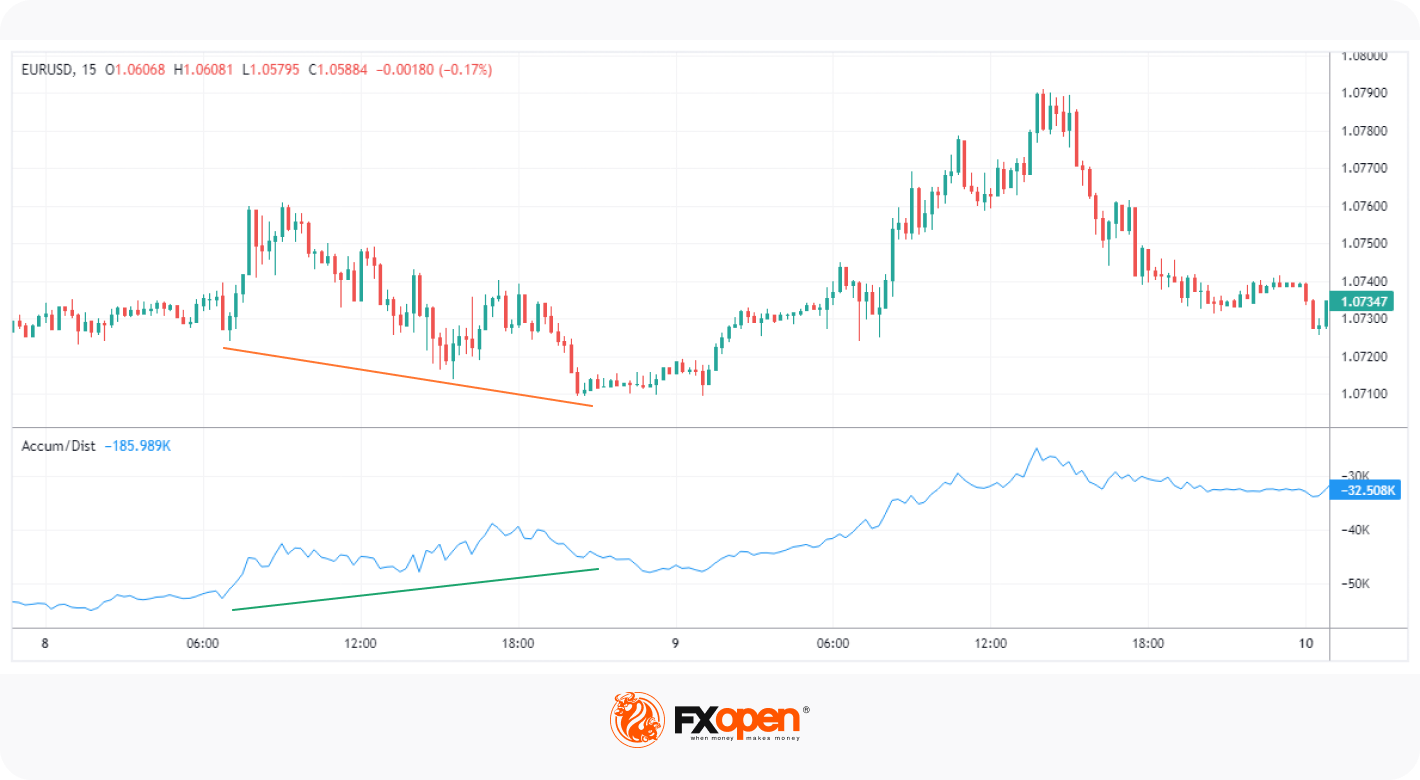
A bullish divergence occurs when the price falls, making lower lows, while the A/D line trends upward, creating higher lows. Conversely, a bearish divergence can be seen when an asset makes new highs, but the A/D puts in lower highs.
It essentially shows us that while the price is moving in a specific direction, the underlying pressure supporting the move is waning. The example above demonstrates that fewer sellers are participating as the trend progresses lower; eventually, buyers take over and push the price much higher.
Trend Confirmation

A/D line can also be used to confirm the direction of a trend. In this context, traders monitor the alignment of the line with the price action.
In an uptrend, both the price and A/D should be rising. If the A/D moves in the same direction as the price, it confirms the strength of the uptrend and suggests that the buying pressure is likely to continue. As in the chart, traders could have used the A/D and price alignment to position themselves in the direction of the bull trend.
Similarly, during a downtrend, the price and the A/D should be falling. If the A/D is falling alongside the price, it indicates that the selling pressure is strong, and the downtrend is likely to persist.
Trading Breakouts

Lastly, A/D can help traders confirm breakouts beyond support/resistance levels. If there’s a critical level that a trader is watching to jump in on the breakout, a breakout beyond a similar level in the A/D indicator can signal the start of a new trend.
In the example, we see a strong resistance level, both in price and the accumulation distribution chart. As the move is confirmed by A/D, breaking out above both dashed lines, traders have confidence that the price is ready to move higher.
Integrating the Accumulation and Distribution Indicator with Other Tools
While the A/D indicator is a valuable tool on its own, it’s best to use it in combination with other indicators to help filter out false signals and improve the accuracy of your predictions. Let’s take a look at two indicators to integrate with A/D: moving averages and the Relative Strength Index (RSI).
Moving Averages

Moving averages are a popular tool used by many traders to determine the direction of a trend, especially when two moving averages cross over. As mentioned, the trajectory of the A/D line can show traders that a trend is supported by volume; similarly, a price sitting above or below a moving average can indicate a trend’s direction. Using the two together can provide an at-a-glance reading of a trend, which can be extremely useful for trend-following traders.
In this example, we’ve used the Exponential Moving Average (EMA) cross indicator in TickTrader, with two 20-period and 50-period EMAs. The fast EMA crosses above the slow EMA, showing that a potential bullish trend is forming. The price continues to stay well above the 50-period EMA as time progresses, demonstrating that there’s a strong bull trend.
We also have confirmation from the A/D line that the bullish momentum is backed up by supporting volume. Seeing this, traders can be confident that the trend will continue. When the EMAs cross over bearishly, as seen on the right-hand side, traders may start looking for the A/D line to confirm that a bearish trend has started and exit their position.
RSI
Similar to the A/D indicator, RSI can be used to both spot divergences and confirm trends. The divergences are the same as A/D; a lower low in a price with a higher low in the RSI indicates a potential bullish reversal, while a price making a higher high and a lower low in RSI is regarded as bearish. Meanwhile, an RSI reading above 50 is typically seen as bullish, while below is bearish.
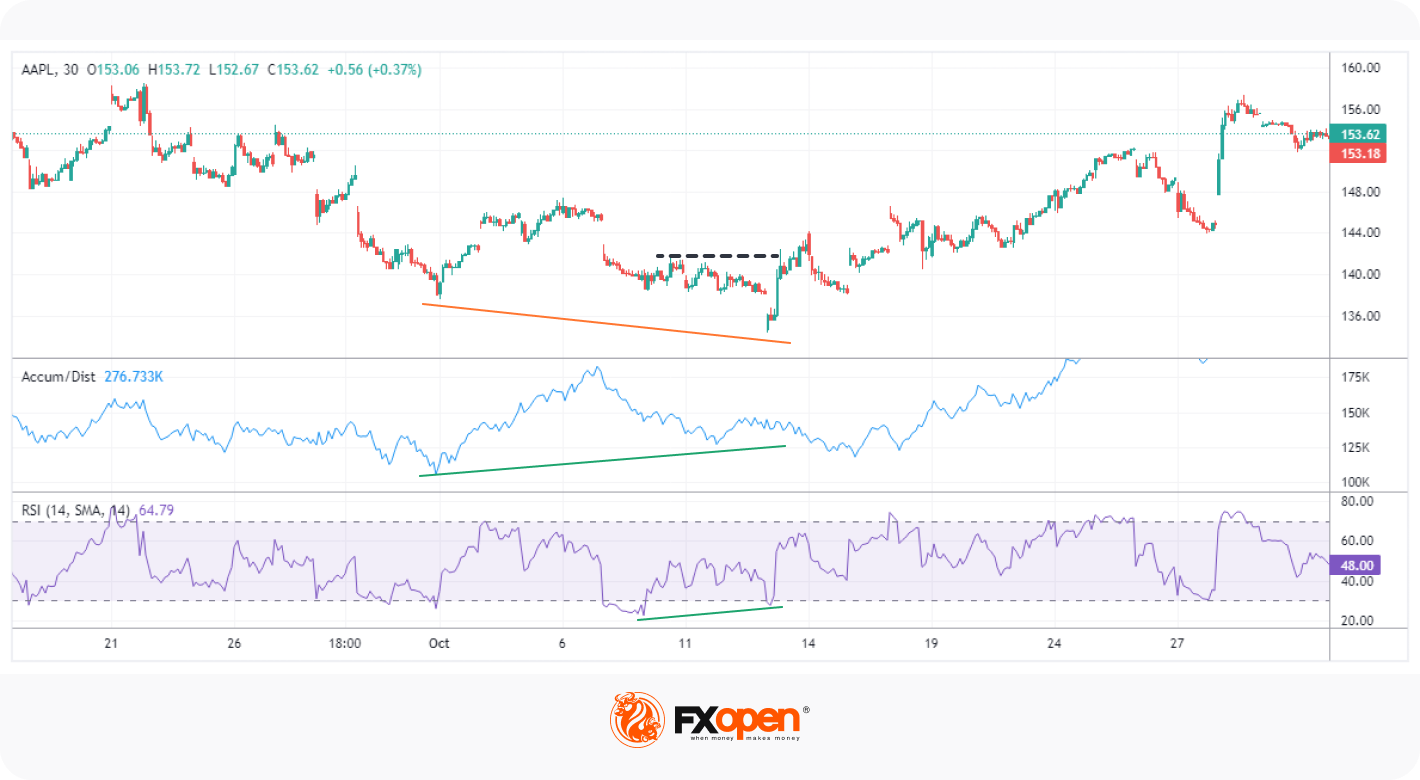
Using the two indicators together can offer traders extra confluence that the market is headed in a particular direction. In the chart shown, we can see that the price is making a lower low. However, the Apple stock’s accumulation/distribution line shows a bullish divergence, as does the RSI.
Traders could have marked the most recent area of resistance (dashed line), and then waited for the price to break out above it before looking for an entry. This move was confirmed by the RSI moving above 50, showing that bullish momentum is truly entering the market and offering multiple factors of confluence.
What to Do Next
You now have a comprehensive understanding of the accumulation/distribution indicator, including its formulation, its three main uses, and how to combine it with other indicators for extra confirmation. Ready to put your newfound knowledge to the test? You can open an FXOpen account to apply what you’ve learned and hone your trading skills across a diverse range of markets, from forex and commodities to stocks and indices.
This article represents the opinion of the Companies operating under the FXOpen brand only. It is not to be construed as an offer, solicitation, or recommendation with respect to products and services provided by the Companies operating under the FXOpen brand, nor is it to be considered financial advice.
Stay ahead of the market!
Subscribe now to our mailing list and receive the latest market news and insights delivered directly to your inbox.


Latest articles

Weekly Market Insights with Gary Thomson: The Week of Central Banks and Earnings
In this video, we’ll explore the key economic events and market trends, shaping the financial landscape. Get ready for insights into financial markets to help you navigate the week ahead. Let’s dive in!
In this episode of Market

Intel at a Crossroads: Earnings Beat Meets Technical Resistance
Intel has just delivered its strongest quarter in over fifteen years, and the market reaction says it all. Q2 2026 revenue surged 25% year-over-year to $16.1 billion, crushing the consensus estimate of $14.42 billion, while adjusted EPS of

Tesla: Complex Range Structure Breaks Down Following Quarterly Earnings
Tesla released its Q2 2026 results after the market closed on 22 July. Revenue increased 26% year-on-year to $28.24 billion, while vehicle deliveries reached a record 480,126 units. However, operating margin fell sharply to 1.4%, down from