


Forex Market Liquidity: Analysis and Implications for Traders
FXOpen
The foreign exchange market is renowned for its dynamic and fast-paced nature. As traders navigate this landscape, understanding the concept of liquidity becomes crucial. In this article, we analyse its components, explore factors that influence it, measure and analyse its impact, discuss potential risks for traders, and present real-life examples to illustrate its implications.
What Is Liquidity in the Forex Market?
Liquidity in the forex market refers to the ease with which a currency pair can be bought or sold without causing a significant change in its price. Highly liquid assets are usually easily tradable, while less liquid assets may experience more considerable price fluctuations during transactions and bear higher spreads.
Liquidity Components
The liquidity of a currency pair is influenced by several factors, which traders need to consider when constructing a liquidity-proof trading strategy. These include the market depth, the bid-ask spread, and the trading volume.
- Market depth represents the number of buy and sell orders at different price levels in the order book. A deep market with many orders at different price levels typically suggests higher liquidity.
- The bid-ask spread is the difference between the highest price a buyer agrees to pay and the lowest price a seller agrees to accept. A narrower spread typically indicates higher liquidity, while a wider spread reflects lower liquidity. Traders often monitor the spread to gauge current conditions.
- Trading volume refers to the total number of currency units traded within a specified period. Higher trading volume generally indicates greater liquidity, signalling a robust trend. Low trading volume could indicate liquidity issues.
Risks for Traders Arising From Liquidity Levels in Forex
Liquidity is a crucial consideration for traders as it directly affects transaction costs and the ease of entering or exiting positions. High levels generally result in lower transaction costs and less slippage, providing traders with potentially more exciting conditions. Additionally, liquidity may contribute to price stability, reducing the impact of large trades on prices.
Low levels, on the other hand, can pose certain risks that traders must be aware of. In illiquid markets, larger trades can have a more pronounced impact on prices, potentially resulting in random price movements and unfavourable execution prices. Forex market liquidity implications suggest that low liquidity can lead to increased volatility, making it challenging to analyse price movements accurately. In low liquidity conditions, traders may also experience slippage and delays in order execution, impacting the efficiency of trades.
Factors Influencing Liquidity in Forex Trading
Various factors influence current market liquidity in the forex market, and understanding these dynamics is essential for traders:
- Market Participants: The presence of a diverse range of participants, including retail traders, institutional investors, and central banks, contributes to liquidity. A balanced mix of participants often leads to a more liquid market.
- Economic Indicators: Economic releases, such as employment data, GDP figures, and interest rate decisions, can significantly impact a currency’s trading activity. Traders often witness increased volatility before and after such data is released, affecting market liquidity.
- Time of Day: Forex operates 24 hours a day, five days a week. Volume varies depending on the time of day, with peak liquidity during the overlap of major trading sessions.

Forex Market Liquidity Indicators and Measures
Assessing quantitative metrics is a fundamental initial step in a profound forex market liquidity analysis. Let’s discuss some popular indicators which can help evaluate the liquidity level using the trading volume:
- On-Balance Volume (OBV): OBV assesses the strength of a price trend by evaluating the relationship between volume flow and price movements. Higher liquidity often accompanies stronger and more sustained price trends.
- Volume Oscillator: When the volume oscillator is positive or above a specific threshold, it indicates that the recent trading volume has been relatively high. This may suggest that there is more liquidity in the asset.
- Money Flow Index (MFI): The MFI considers trading volume as a component of its calculation. A high trading volume, when combined with significant price movements, can result in a higher MFI reading, indicating strong market participation and potentially higher liquidity. A low trading volume during price movements may result in a lower MFI reading, suggesting reduced liquidity and potentially less market interest.
Price Gaps: In illiquid markets, there are fewer participants and lower trading volumes. In such conditions, price gaps are more likely to happen and can be more substantial. With fewer participants, it becomes challenging to match buyers and sellers efficiently. As a result, a significant order or news event can lead to a notable price gap when the market reopens.
You can visit FXOpen and explore new trading opportunities for some of the most liquid currency pairs through the free TickTrader trading platform.
Real-Life Examples of FX Liquidity
To illustrate the importance of considering liquidity in a forex strategy and how it can impact trader behaviour, let’s consider some real-life examples:
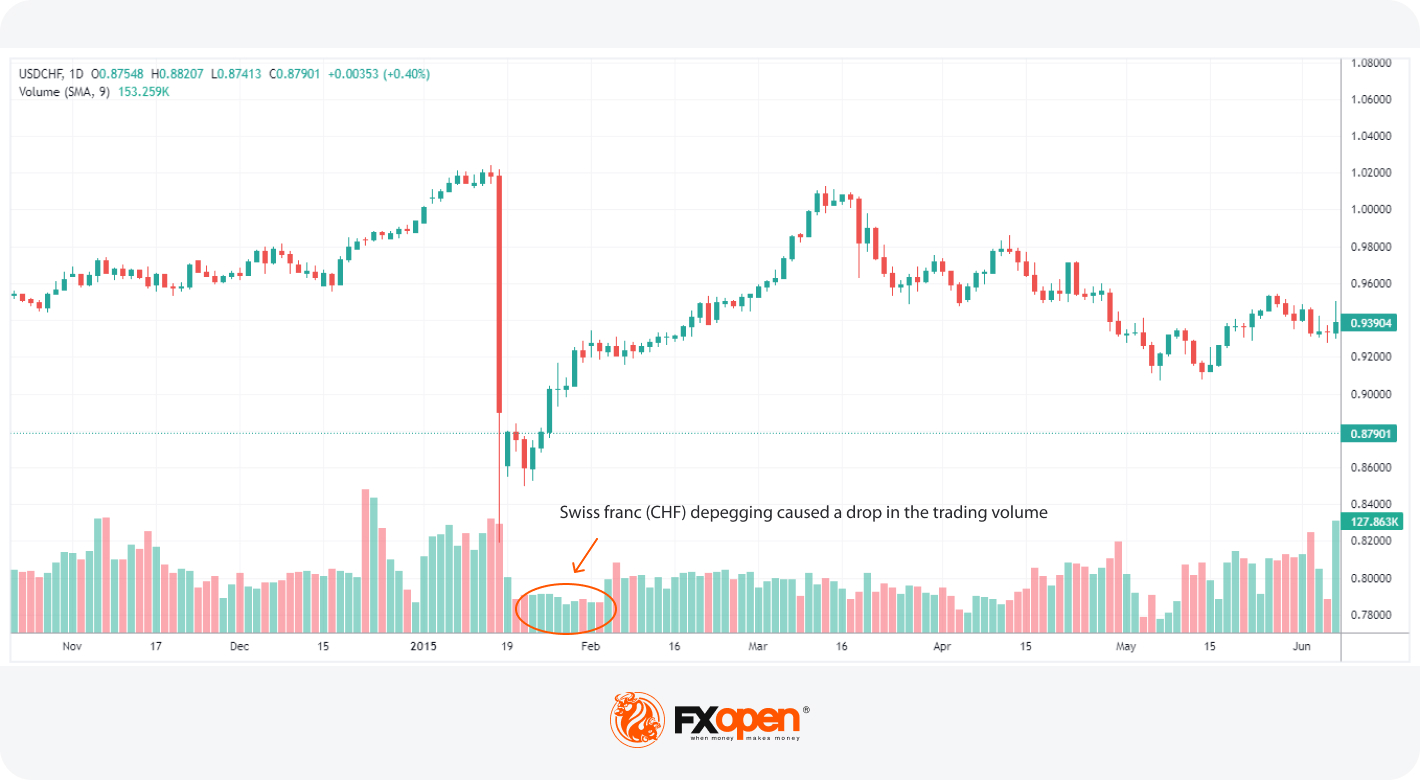
The 2015 Swiss Franc Depegging
In 2015, the sudden decision by the Swiss National Bank (SNB) to remove the Swiss Franc (CHF) peg against the euro had a profound impact on the forex. The depegging in January 2015 led to a sudden drop in value, causing not only an unprecedented shift in trading dynamics but also triggering a significant price gap. The market experienced a reduction in trading volume, highlighting the challenges of liquidity in the face of unexpected events.
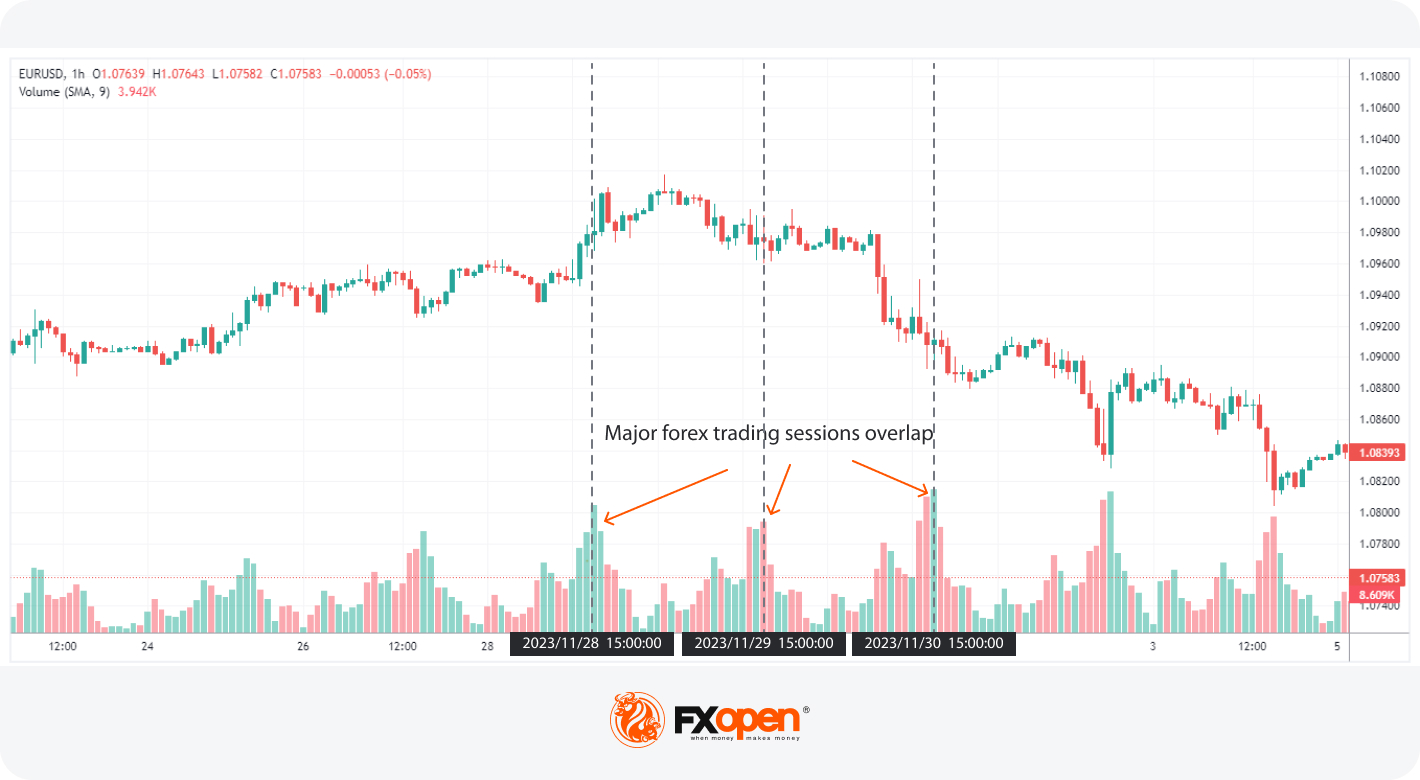
High Volumes During Trading Session Overlaps
The EUR/USD currency pair experiences varying trading volumes throughout different global sessions, primarily influenced by the overlap of major trading hours. The chart below depicts the significant volume spikes occurring during the overlap between the European (UTC 08:00 - 17:00) and North American (UTC 13:00 - 22:00) sessions, commonly known as the "London-New York overlap." This period witnesses peak trading volumes, providing traders with optimal conditions for executing trades.
Takeaway
Understanding liquidity is paramount for traders navigating the complexities of the financial markets. By comprehending the components of trading activity and analysing influencing factors and their impact on real-life trading, traders may make more informed decisions to potentially reduce risks and optimise their trading strategies. You trade forex and commodity, stock, and index CFDs today by opening an FXOpen account!
This article represents the opinion of the Companies operating under the FXOpen brand only. It is not to be construed as an offer, solicitation, or recommendation with respect to products and services provided by the Companies operating under the FXOpen brand, nor is it to be considered financial advice.
Stay ahead of the market!
Subscribe now to our mailing list and receive the latest market news and insights delivered directly to your inbox.


Latest articles

Nasdaq 100: 48 Hours of Chaos, One Trendline Standing in the Way
Wall Street just lived through one of its wildest 48 hours of the year. On Wednesday, the Fed held rates steady at 3.50%-3.75%, but three FOMC members broke ranks to demand a hike—an unusually hawkish dissent

Amazon Analysis: Strong Earnings Coincide with a Breakout from the Correction
On 30 July, Amazon.com reported its financial results for the second quarter of 2026, significantly exceeding market expectations. Revenue rose 20% year-on-year to $200.6 billion, compared with the consensus forecast of around $196.5 billion. The main growth

GBP/USD and EUR/GBP Await Key Bank of England Decision
The pound strengthened following the outcome of the US Federal Reserve meeting, where the central bank, as expected, kept interest rates unchanged. However, the Fed did not provide the market with clear signals of an imminent shift towards rate cuts,