


FXOpen
Gold price remained in a bearish zone and declined below the $1,310 support area. Crude oil price is following a bearish structure below the $53.20 and $53.60 levels.
Important Takeaways for Gold and Oil
- Gold price started a major decline and traded below the $1,316 and $1,310 supports against the US Dollar.
- There is a major bearish trend line in place with resistance at $1,310 on the hourly chart of gold.
- Crude oil price traded lower and broke the $54.00 and $53.60 support levels.
- There is a declining channel formed with resistance at $53.75 on the hourly chart of XTI/USD.
Gold Price Technical Analysis
After a decent upward move, gold price faced a strong resistance near the $1,325 level against the US Dollar. The price started a downside move and broke the $1,320, $1,316 and $1,310 support levels.
The price even broke the $1,306 support level and traded close to $1,300. A low was formed at $1,302 on FXOpen and later the price started an upside correction. It moved above the $1,305 and $1,306 resistance levels.
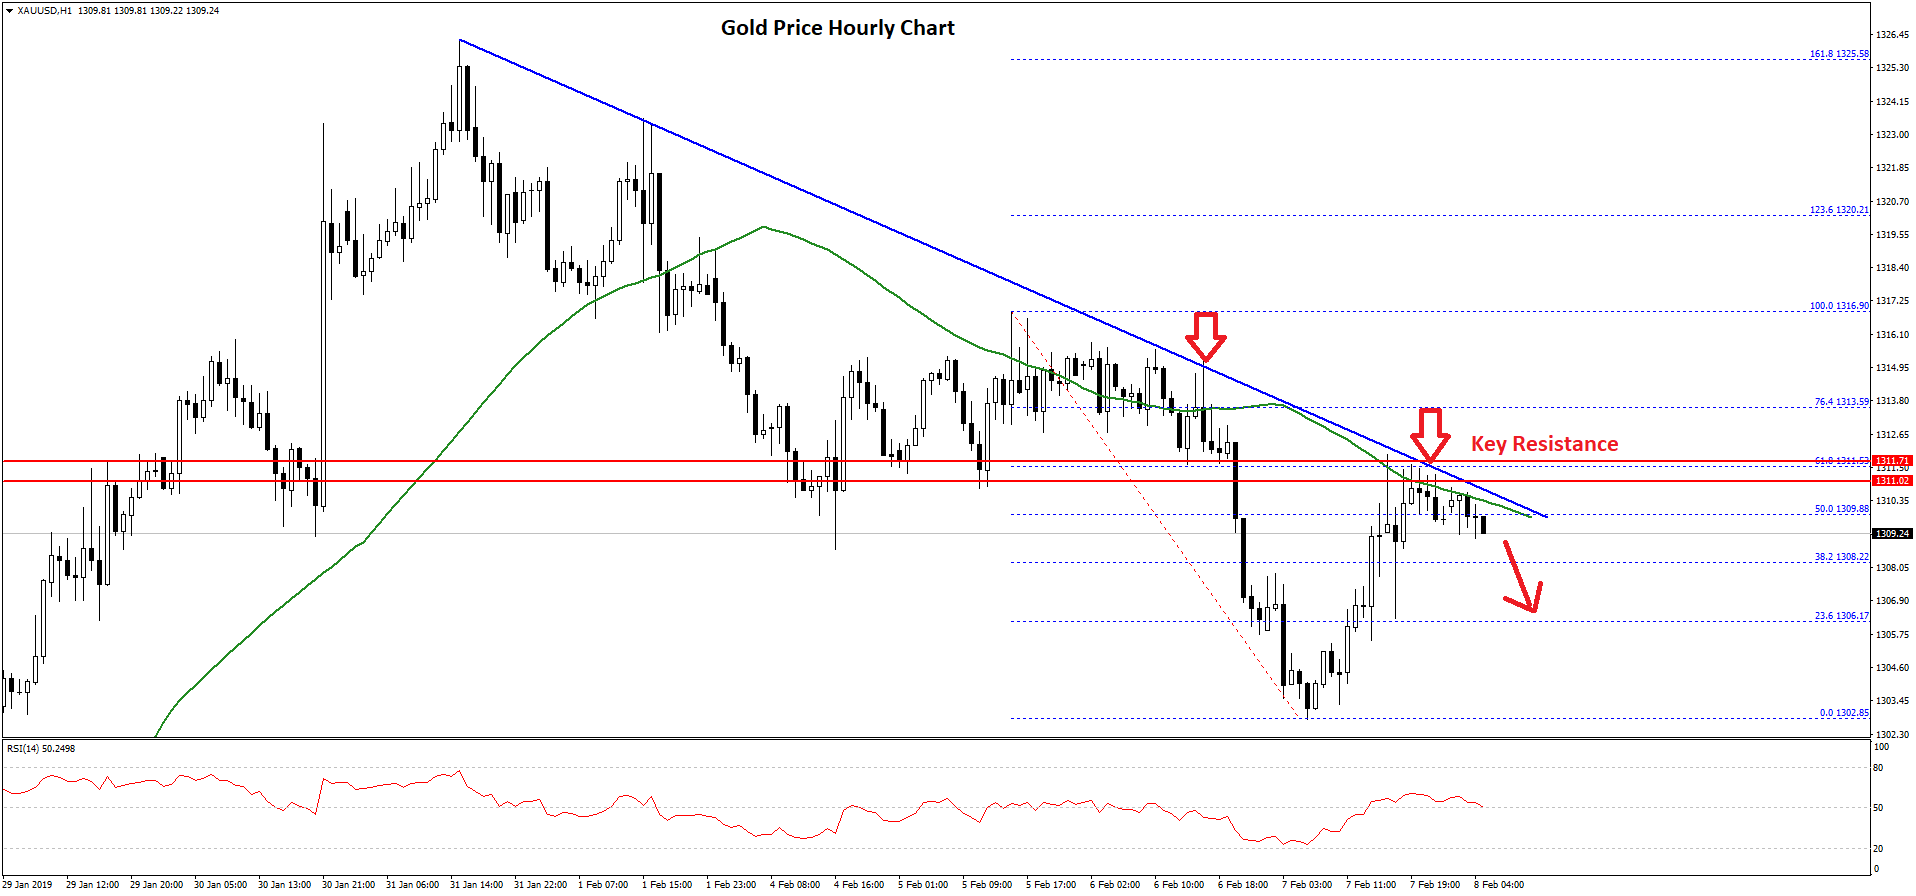
There was a break above the 50% Fib retracement level of the recent decline from the $1,316 high to $1,302 low. However, the price faced a strong resistance near the $1,310-1,311 area and the 50 hourly simple moving average.
Moreover, the price failed near the 61.8% Fib retracement level of the recent decline from the $1,316 high to $1,302 low. Finally, there is a major bearish trend line in place with resistance at $1,310 on the hourly chart of gold.
The current price action suggests that the price is trading below the key $1,310 resistance plus the 50 hourly simple moving average. If it continues to struggle, there could be a fresh decline towards the $1,306 and $1,302 support levels.
On the other hand, an upside break above the $1,310 resistance plus the 50 hourly simple moving average might push the price towards the $1,315 level.
Oil Price Technical Analysis
Crude oil price also started a downside move after it failed to break the $56.00 resistance against the US Dollar. The price traded lower and broke the $55.00 and $54.00 support levels to move into a bearish zone.
More importantly, there was a break below the $53.60 support and the 50 hourly simple moving average. The price traded close to the $52.00 level and a low was formed at $52.08. Later, there was a minor upside correction above the $52.50 level.
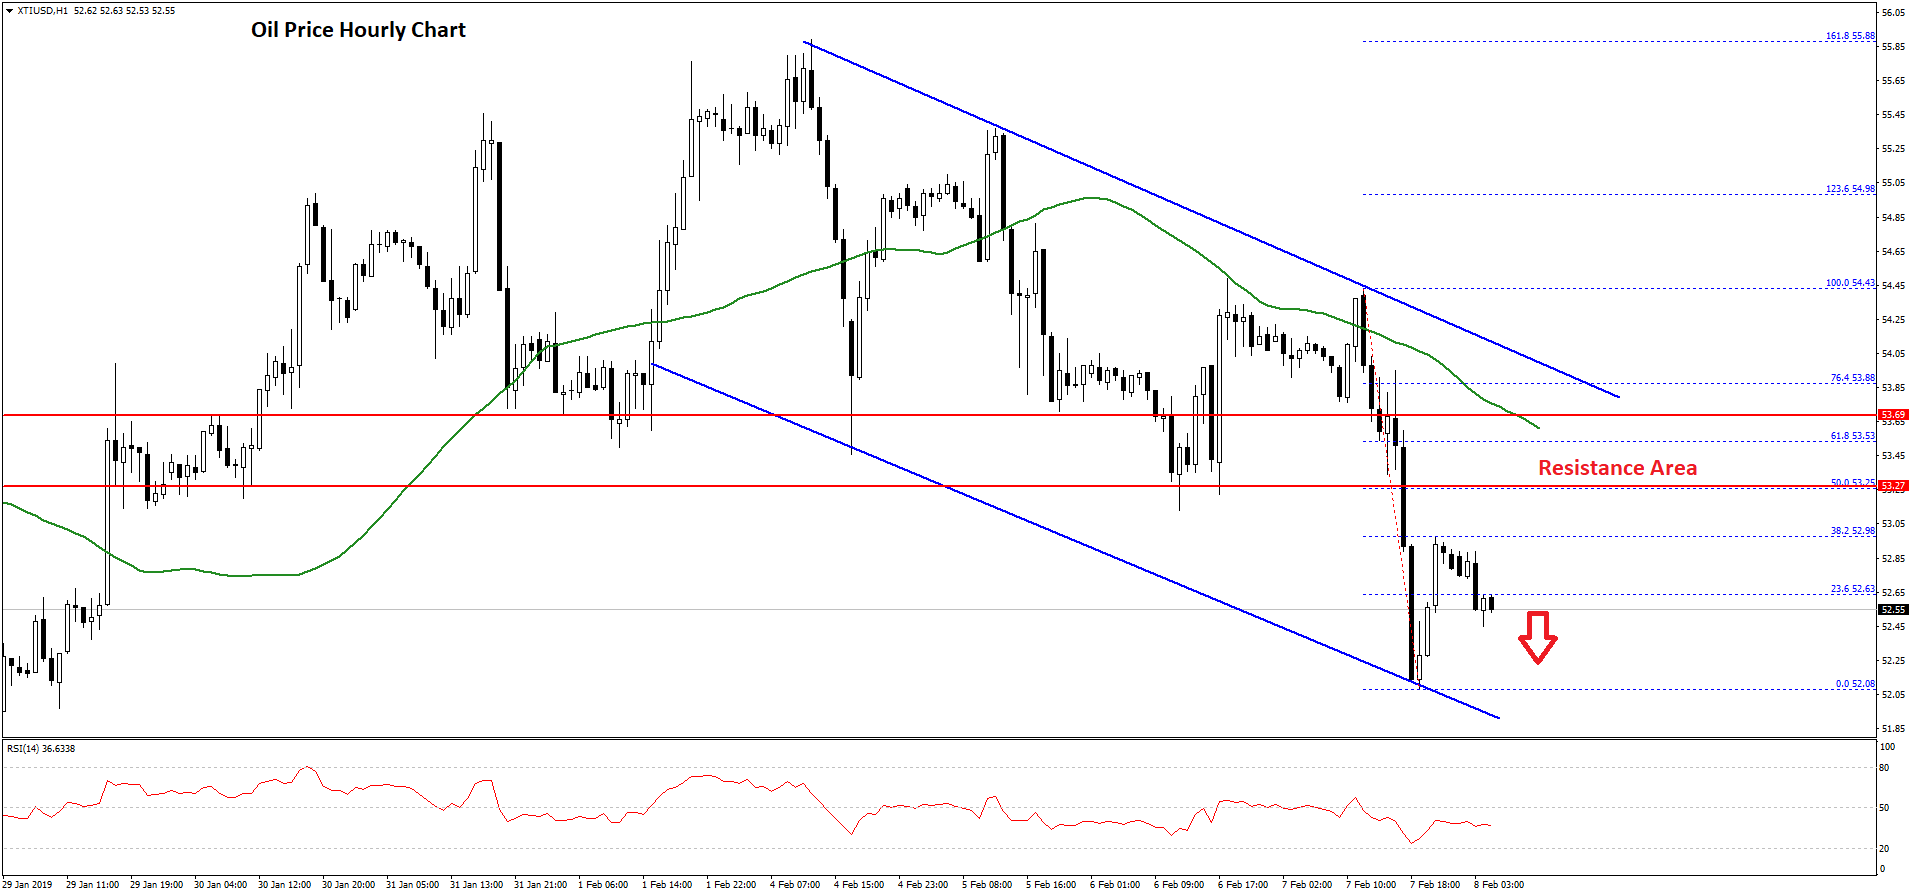
There was a break above the 23.6% Fib retracement level of the recent decline from the $54.43 high to $52.08 low. However, the price seems to be struggling near the $53.00 resistance.
At the outset, there is a declining channel formed with resistance at $53.75 on the hourly chart of XTI/USD. On the upside, the most important resistance is near the $53.50 and $53.60 levels.
Besides, the 50% Fib retracement level of the recent decline from the $54.43 high to $52.08 low is near the $53.25 level to act as a resistance. Therefore, if there is an upside correction towards the $53.25 and $53.50 levels, sellers are likely to defend gains.
On the downside, an initial support is at $52.20, below which the price could test the $52.00 support. The main supports are visible near $51.50 and $51.20.
Trade over 50 forex markets 24 hours a day with FXOpen. Take advantage of low commissions, deep liquidity, and spreads from 0.0 pips. Open your FXOpen account now or learn more about trading forex with FXOpen.
This article represents the opinion of the Companies operating under the FXOpen brand only. It is not to be construed as an offer, solicitation, or recommendation with respect to products and services provided by the Companies operating under the FXOpen brand, nor is it to be considered financial advice.
Stay ahead of the market!
Subscribe now to our mailing list and receive the latest market news and insights delivered directly to your inbox.


Latest articles

Natural Gas Prices Fell in Late December
On 4 December, while analysing the XNG/USD chart, we highlighted the rally in natural gas prices towards a three-year high and noted that the price had entered a resistance zone formed by:
→ the upper boundary of a broad descending


Gold Price Analysis: Price Retreats From Record Highs
As the XAU/USD chart shows, gold rallied yesterday to near its October all-time high around the 4,380 level, before pulling back (as indicated by the arrow).
The surge in volatility was driven by a combination of factors:
→ Expectations