


FXOpen
Gold price started a downside correction after it climbed towards the $1,360 resistance area. Crude oil price seems to be forming a breakout pattern and is preparing for the next break.
Important Takeaways for Gold and Oil
- Gold price started a downside correction after trading as high as $1,258 against the US Dollar.
- There was a break below a key bullish trend line with support at $1,342 on the hourly chart of gold.
- Crude oil price recovered recently and traded above the $52.00 resistance area.
- There is a major contracting triangle forming with resistance near $53.00 on the hourly chart of XTI/USD.
Gold Price Technical Analysis
Gold price found support near the $1,320 level and climbed above the $1,340 resistance area against the US Dollar. The price even broke the key $1,350 resistance area to climb further higher.
The upward move was strong as the price traded close to the $1,360 level. A swing high was formed near $1,358 on FXOpen before the price started a major downside correction.
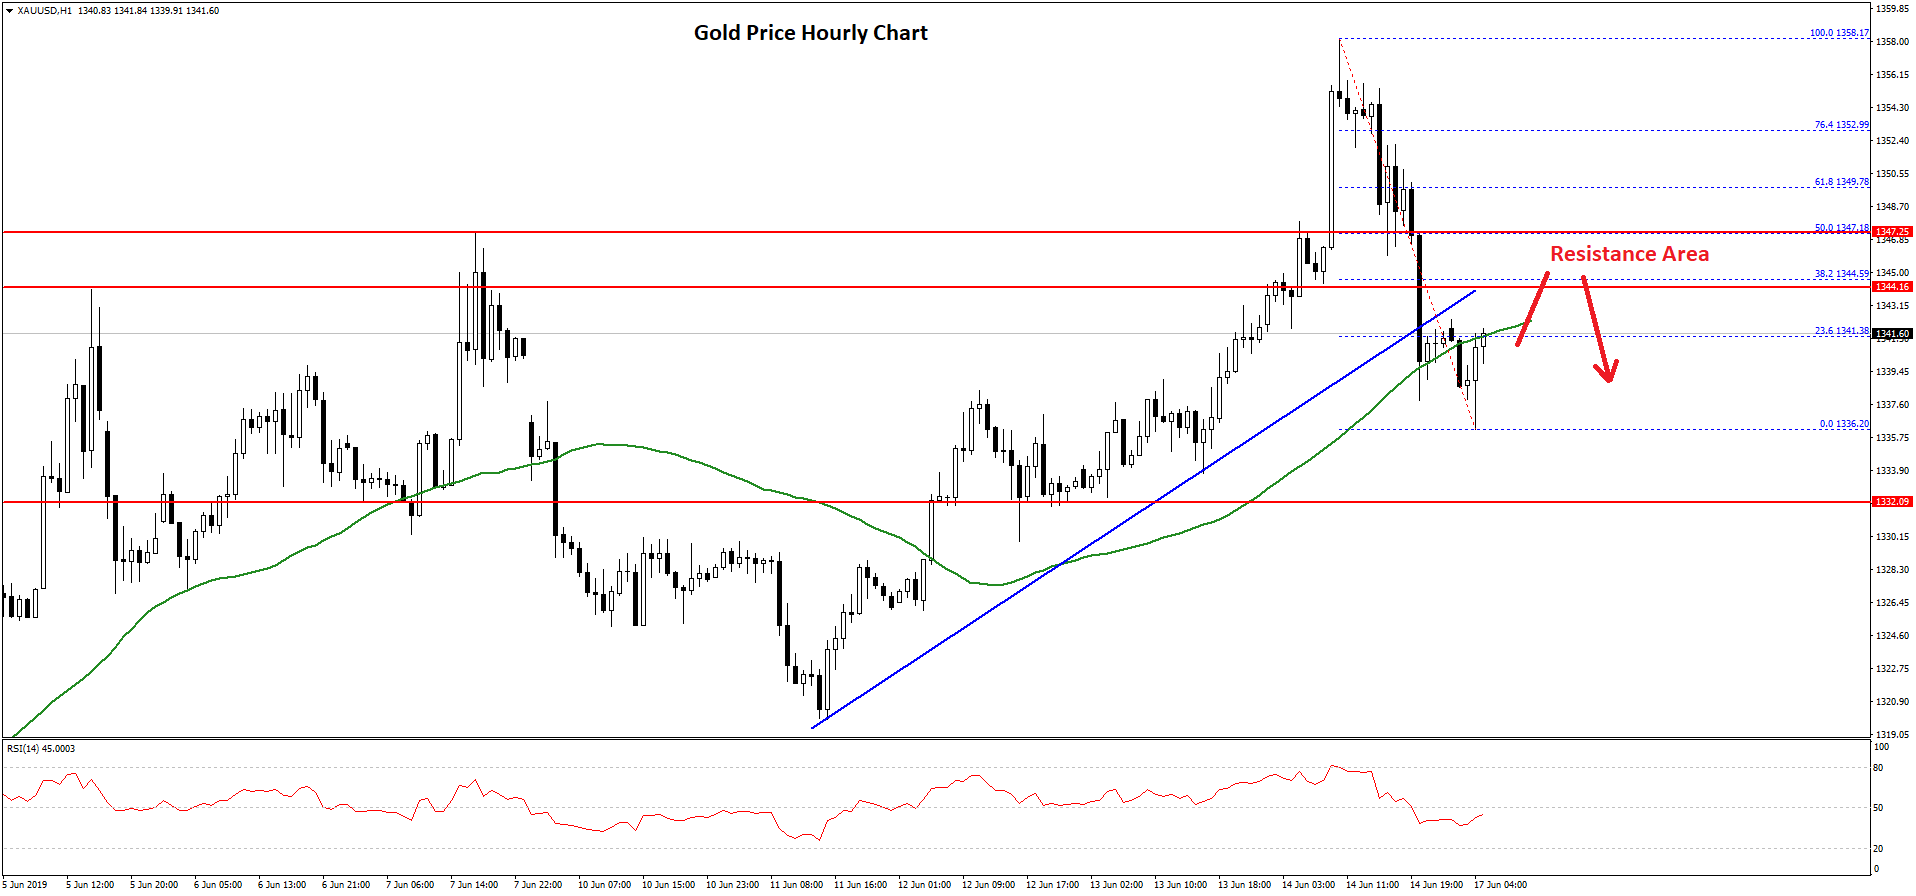
It broke the $1,355 and $1,350 support levels to move into a short term bearish zone. Moreover, there was a break below a key bullish trend line with support at $1,342 on the hourly chart of gold.
Finally, the price spiked below the $1,340 level and the 50 hourly simple moving average. A swing low was formed at $1,336 and the price is currently recovering higher.
It is trading near the $1,342 level, the 50 hourly simple moving average, and the 23.6% Fib retracement level of the recent decline from the $1,358 high to $1,336 swing low.
On the upside, there are many hurdles near the $1,344 and $1,347 levels. The main resistance is near the $1,347 level plus the 50% Fib retracement level of the recent decline from the $1,358 high to $1,336 swing low.
A successful close above the $1,347 and $1,348 levels might start a fresh increase towards the $1,355 and $1,360 resistance levels. Conversely, if the price fails to climb above $1,344 and $1,347, it could decline again below $1,340 and $1,335.
Oil Price Technical Analysis
After a steady decline, crude oil price found support near the $51.00 level against the US Dollar. The price started a slow and steady rise above the $5,120 and $51.50 resistance levels.
The price even managed to recover above the $52.00 barrier and the 50 hourly simple moving average. The recent swing high was formed at $53.21 before the price corrected lower.
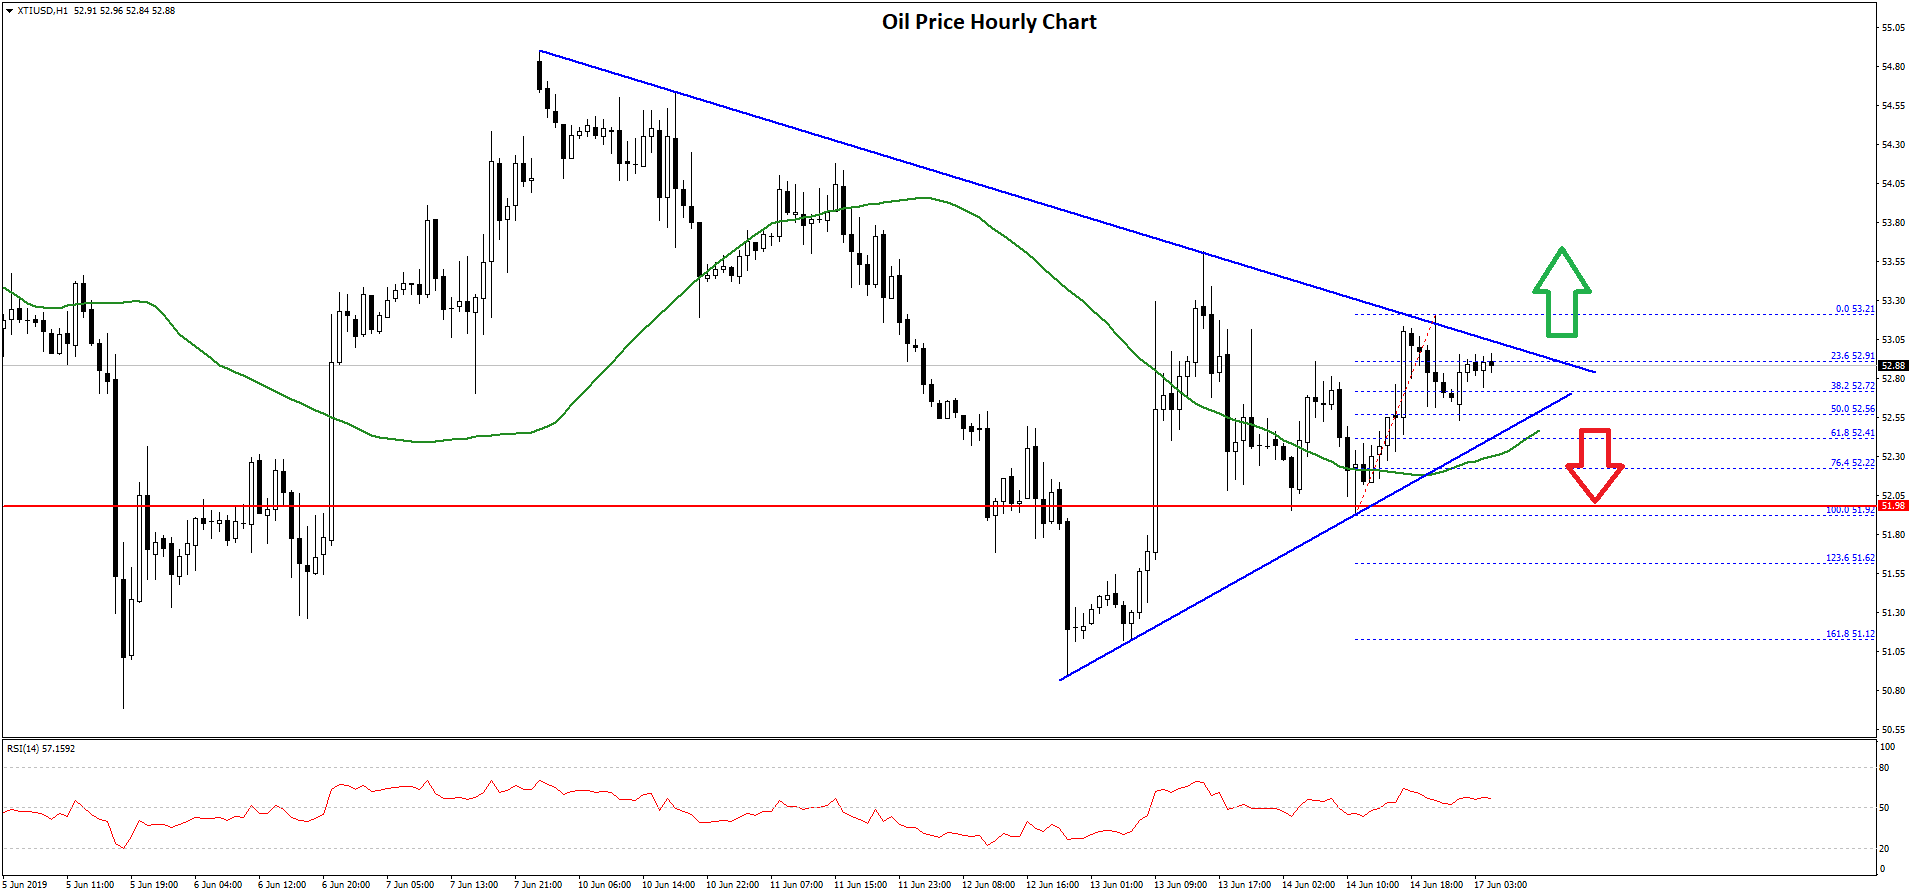
It traded below the $53.00 level and the 23.6% Fib retracement level of the recent wave from the $51.92 low to $53.21 high.
However, the decline was protected by the $52.50 level plus the 50% Fib retracement level of the recent wave from the $51.92 low to $53.21 high. The price is now moving higher and is trading near the $52.90 and $53.00 resistance levels.
Moreover, there is a major contracting triangle forming with resistance near $53.00 on the hourly chart of XTI/USD. If there is an upside break above the $53.00 barrier, the price could continue higher towards $53.20 and $53.50.
On the downside, the main support is near the $52.40 level, below which crude oil price might start a fresh decline below the $52.00 support area.
Trade over 50 forex markets 24 hours a day with FXOpen. Take advantage of low commissions, deep liquidity, and spreads from 0.0 pips. Open your FXOpen account now or learn more about trading forex with FXOpen.
This article represents the opinion of the Companies operating under the FXOpen brand only. It is not to be construed as an offer, solicitation, or recommendation with respect to products and services provided by the Companies operating under the FXOpen brand, nor is it to be considered financial advice.
Stay ahead of the market!
Subscribe now to our mailing list and receive the latest market news and insights delivered directly to your inbox.


Latest articles

Natural Gas Prices Fell in Late December
On 4 December, while analysing the XNG/USD chart, we highlighted the rally in natural gas prices towards a three-year high and noted that the price had entered a resistance zone formed by:
→ the upper boundary of a broad descending


Gold Price Analysis: Price Retreats From Record Highs
As the XAU/USD chart shows, gold rallied yesterday to near its October all-time high around the 4,380 level, before pulling back (as indicated by the arrow).
The surge in volatility was driven by a combination of factors:
→ Expectations