


FXOpen

Gold price made an attempt to surpass the $1,860 resistance, but there was a major rejection. Crude oil price seems to be consolidating gains above $51.50 and $51.20.
Important Takeaways for Gold and Oil
- Gold price is still trading below the main $1,860 and $1,880 resistance levels against the US Dollar.
- There is a major bearish trend line forming with resistance near $1,855 on the hourly chart of gold.
- Crude oil price seems to be facing a strong resistance near the $53.50 and $54.00 levels.
- There is likely an expanding triangle forming with support near $52.00 on the hourly chart of XTI/USD.
Gold Price Technical Analysis
Gold price settled below the main $1,900 pivot level to move into a bearish zone against the US Dollar. The price even settled below the $1,880 level and the 50 hourly simple moving average.
On the downside, the price is finding strong bids above the $1,830 and $1,835 levels. Recently, there was a sharp recovery above the $1,850 level and the 50 hourly simple moving average. However, the price failed to clear the $1,860 resistance level.
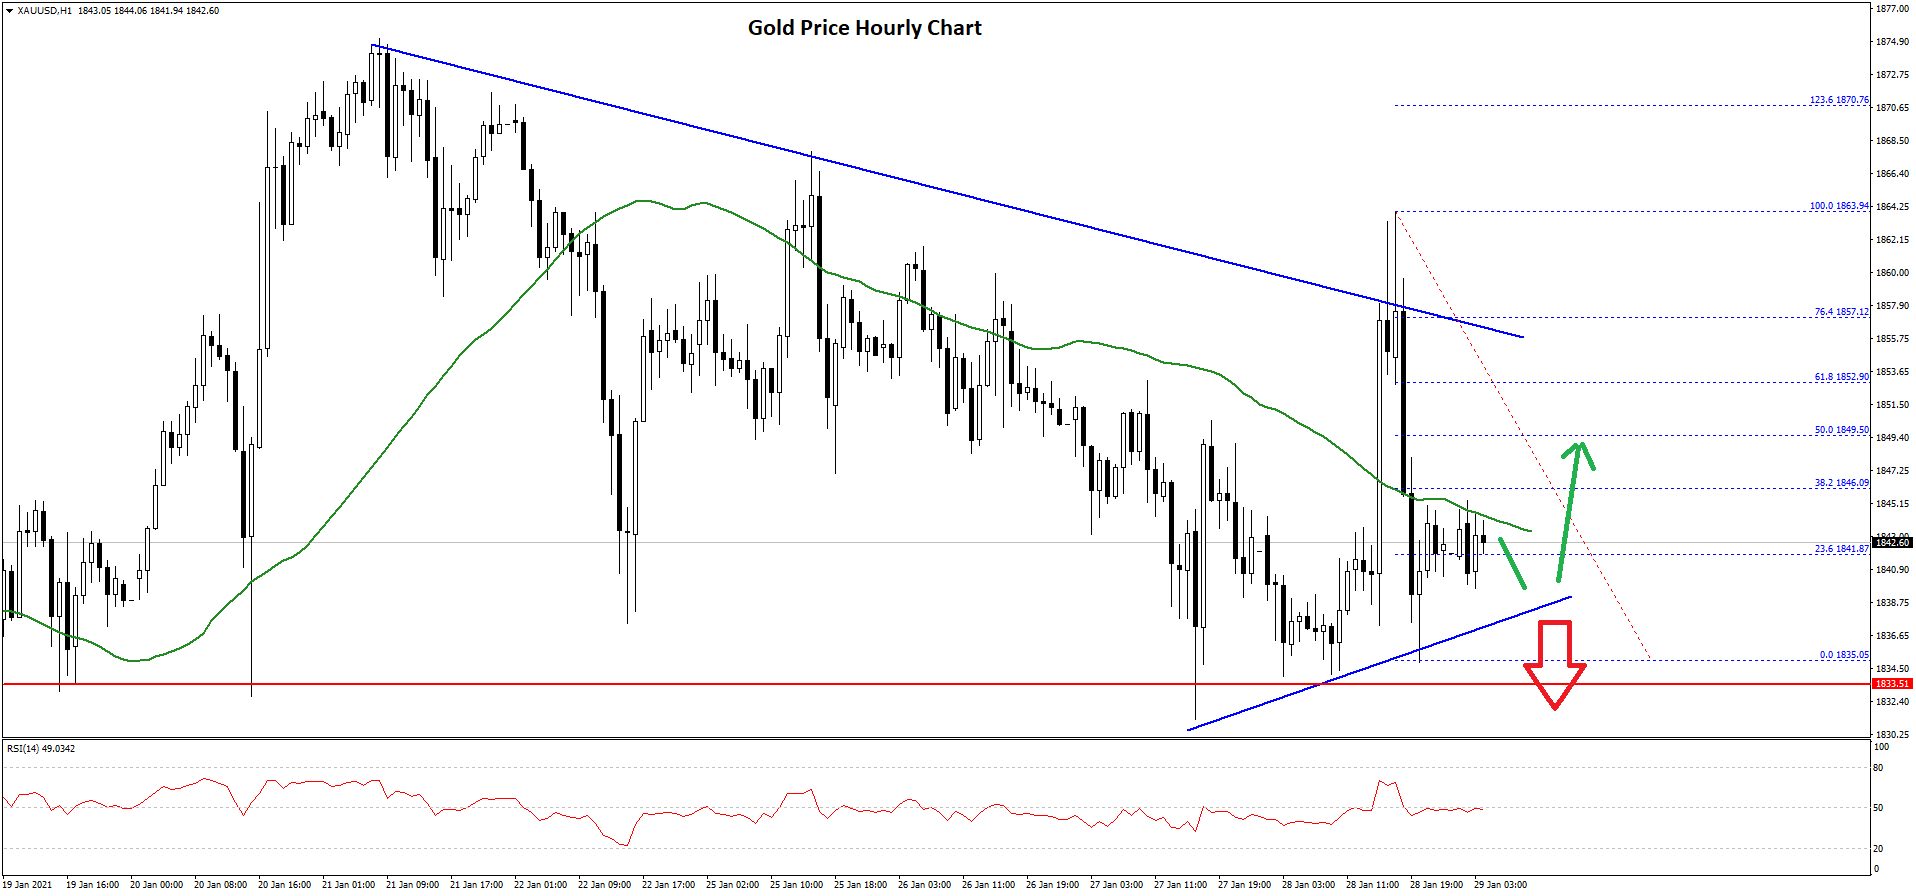
A high was formed near $1,863 on FXOpen before there was a fresh decline. A low is formed near $1,835 and the price is currently consolidating losses.
There was a break above the 23.6% Fib retracement level of the downward move from the $1,863 swing high to $1,838 low. It is now facing resistance near the $1,845 level and the 50 hourly simple moving average.
The next major resistance is near the $1,850 level. The 50% Fib retracement level of the downward move from the $1,863 swing high to $1,838 low is at $1,850. There is also a major bearish trend line forming with resistance near $1,855 on the hourly chart of gold.
On the downside, there is a connecting bullish trend line forming with support near $1,838. The first key support is near the $1,830 level. The next major support is at $1,820, below which the price might test the $1,800 support level.
Oil Price Technical Analysis
Crude oil price remained in a strong uptrend well above the $50.00 resistance zone against the US Dollar. The price settled nicely above $52.00 and it even made a few attempts to gain strength above the $54.00 level.
The recent high was formed near $53.47 before the price trimmed most gains. It broke the $53.00 support and tested the $52.00 level.
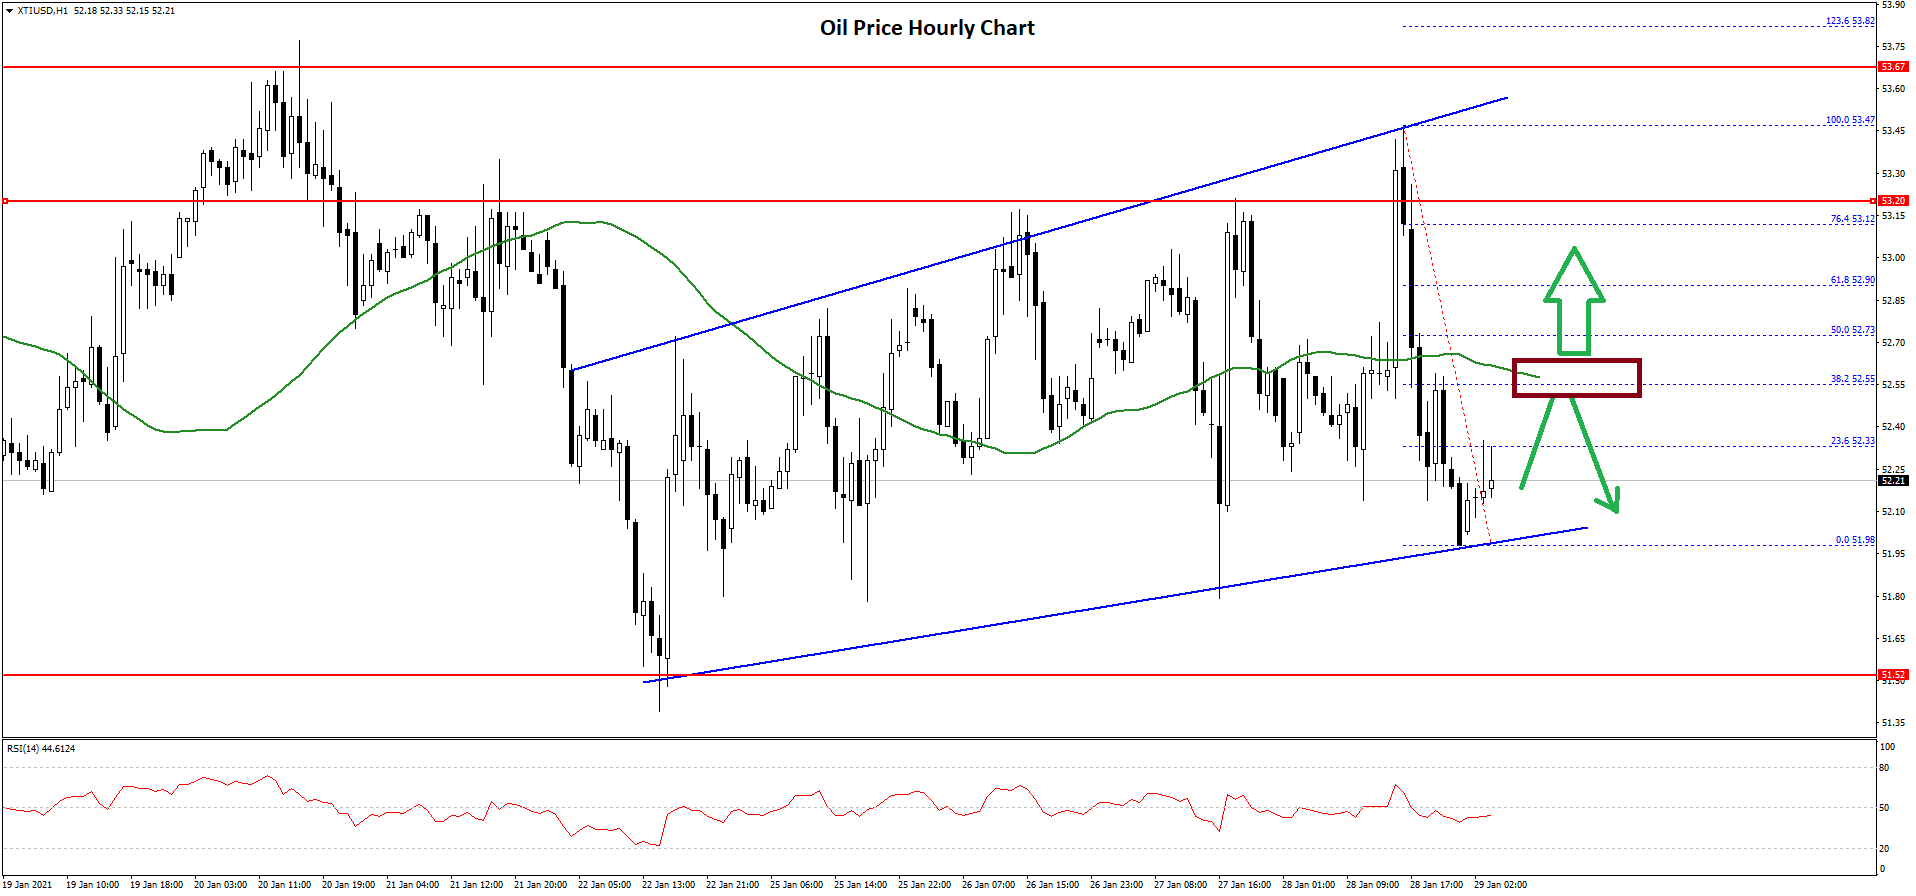
A low is formed near $51.98 and the price is currently consolidating. It tested the 23.6% Fib retracement level of the recent decline from the $53.47 high to $51.98 low. The first major resistance is near the $52.55 level and the 50 hourly simple moving average.
The next key resistance is near the $52.75 level or the 50% Fib retracement level of the recent decline from the $53.47 high to $51.98 low.
Moreover, it seems like there is likely an expanding triangle forming with support near $52.00 on the hourly chart of XTI/USD. If there are more downsides below the triangle support, the price could test the $51.50 support.
The next key support is near the $51.20 level. On the upside, the $53.50 and $54.00 levels are major hurdles. A clear break above $54.00 may possibly lead the price towards the $55.00 level.
Trade over 50 forex markets 24 hours a day with FXOpen. Take advantage of low commissions, deep liquidity, and spreads from 0.0 pips. Open your FXOpen account now or learn more about trading forex with FXOpen.
This article represents the opinion of the Companies operating under the FXOpen brand only. It is not to be construed as an offer, solicitation, or recommendation with respect to products and services provided by the Companies operating under the FXOpen brand, nor is it to be considered financial advice.
Stay ahead of the market!
Subscribe now to our mailing list and receive the latest market news and insights delivered directly to your inbox.


Latest articles

Natural Gas Prices Fell in Late December
On 4 December, while analysing the XNG/USD chart, we highlighted the rally in natural gas prices towards a three-year high and noted that the price had entered a resistance zone formed by:
→ the upper boundary of a broad descending


Gold Price Analysis: Price Retreats From Record Highs
As the XAU/USD chart shows, gold rallied yesterday to near its October all-time high around the 4,380 level, before pulling back (as indicated by the arrow).
The surge in volatility was driven by a combination of factors:
→ Expectations