


FXOpen

In 2024, the Nasdaq 100 index (US Tech 100 mini on FXOpen) has risen by approximately 20%, with optimism around the integration of artificial intelligence (AI) acting as one of the bullish drivers.
However, yesterday's reports from Microsoft (MSFT) and Meta Platforms (META) indicated that AI, as a factor influencing stock prices, may be shifting from a bullish to a bearish driver. The issue lies in the rising expenses that these tech giants are incurring in the race for leadership in this area.
Earlier today, we noted that due to increasing expenditures, MSFT shares fell by roughly 4%, despite a strong earnings report.
A similar trend is seen in Meta Platforms' stock: actual earnings per share and gross revenue exceeded analysts’ expectations. However, due to high capital investments, META shares in pre-market trading today are around 3% lower than yesterday's opening.
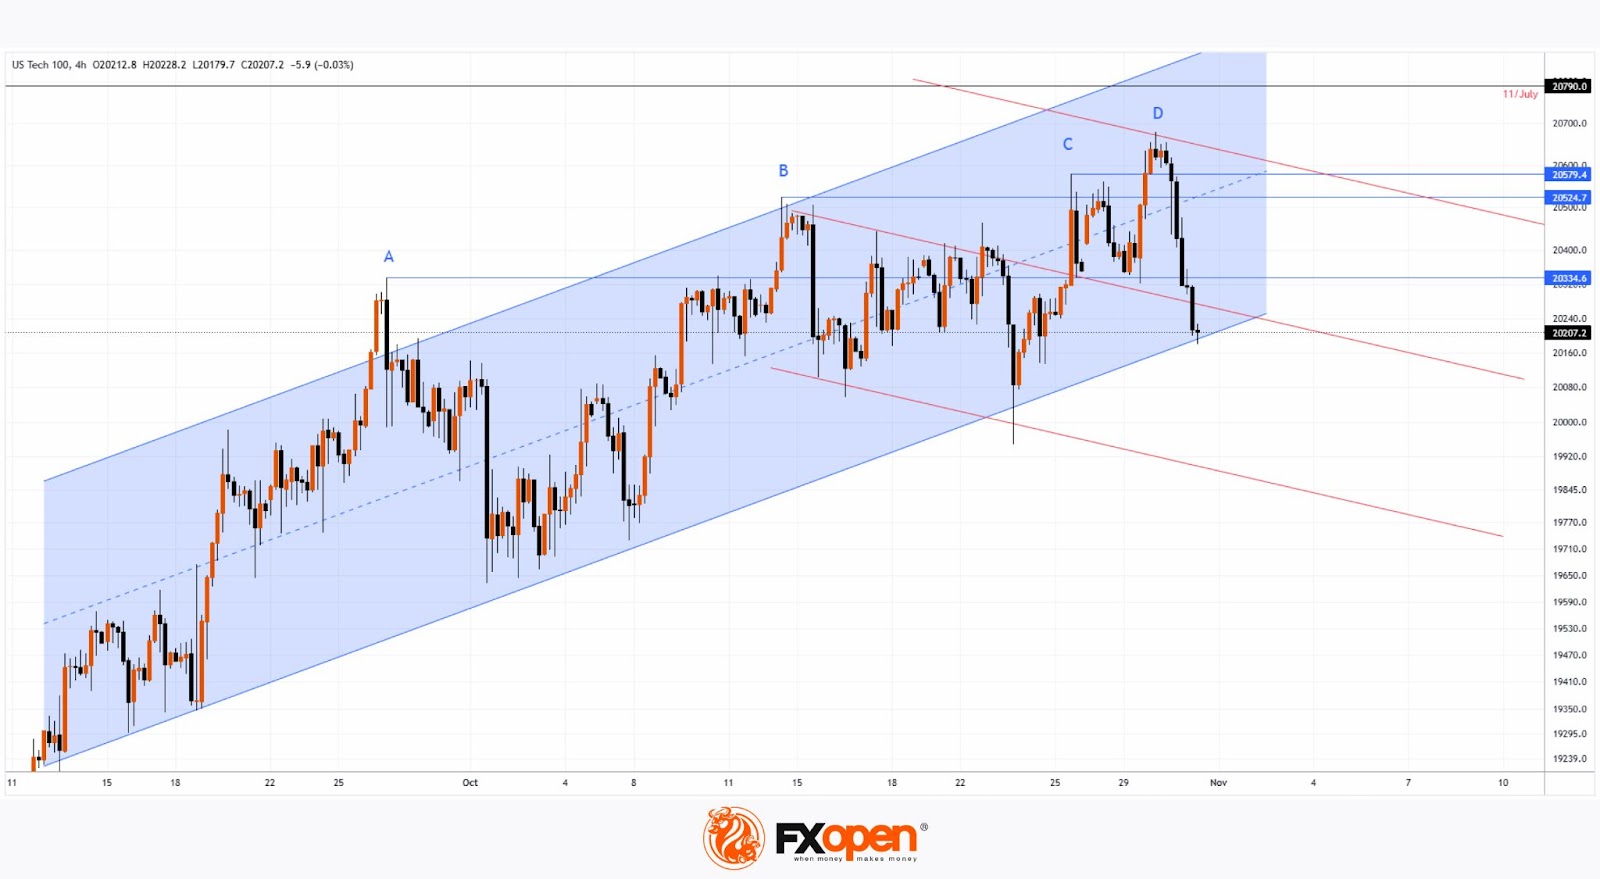
Meanwhile, technical analysis of the Nasdaq 100 (US Tech 100 mini on FXOpen) index chart indicates several bearish signals:
→ Since mid-September, price fluctuations have formed an ascending channel, constructed using linear regression (shown in blue). However, following the reports from Microsoft and Meta Platforms, the index value has sharply dropped from the upper half of the channel to its lower boundary.
→ The pattern of peaks A-B-C-D shows that bulls find it difficult to maintain momentum: each successive peak only slightly exceeds the previous one, followed by a decline.
Considering this information, it is reasonable to assume that the current ascending channel may be unable to drive the price to the July 11 peak and could be breached by bears. Additionally, the formation of a bearish channel is not out of the question (its preliminary outline is shown in red).
Trade global index CFDs with zero commission and tight spreads (additional fees may apply). Open your FXOpen account now or learn more about trading index CFDs with FXOpen.
This article represents the opinion of the Companies operating under the FXOpen brand only. It is not to be construed as an offer, solicitation, or recommendation with respect to products and services provided by the Companies operating under the FXOpen brand, nor is it to be considered financial advice.
Stay ahead of the market!
Subscribe now to our mailing list and receive the latest market news and insights delivered directly to your inbox.


Latest articles

Market Analysis: GBP/USD Dips Further As EUR/GBP Regains Traction
GBP/USD failed to climb above 1.3500 and corrected some gains. EUR/GBP started a decent increase and might aim for more gains above 0.8700.
Important Takeaways for GBP/USD and EUR/GBP Analysis Today
· The British Pound


Market Insights with Gary Thomson: Oil, US Retail Sales & NFP in Focus
In this video, we’ll explore the key economic events and market trends, shaping the financial landscape. Get ready for insights into financial markets to help you navigate the week ahead. Let’s dive in!
In this episode of Market