


What Is the Three White Soldiers Candlestick Pattern? Identification, Trading, and Common Mistakes
FXOpen

There are numerous candlestick patterns and these are divided into two main categories: continuation and reversal. Reversal formations help traders enter the market at the early stages of a new trend to make the most of the trend trading. 3 white soldiers pattern is one of these.
It is a combination of three candles formed together and is used to determine a price rise after a solid downtrend. The three white soldiers formation appears on price charts very often. Therefore, traders with any level of experience use it when trading. What is the 3 white soldiers in stock, forex, commodity, or cryptocurrency* trading? What is the difference between the 3 white soldiers and the 3 black crows? This FXOpen article will answer these questions.

What Is the Three White Soldiers Pattern?
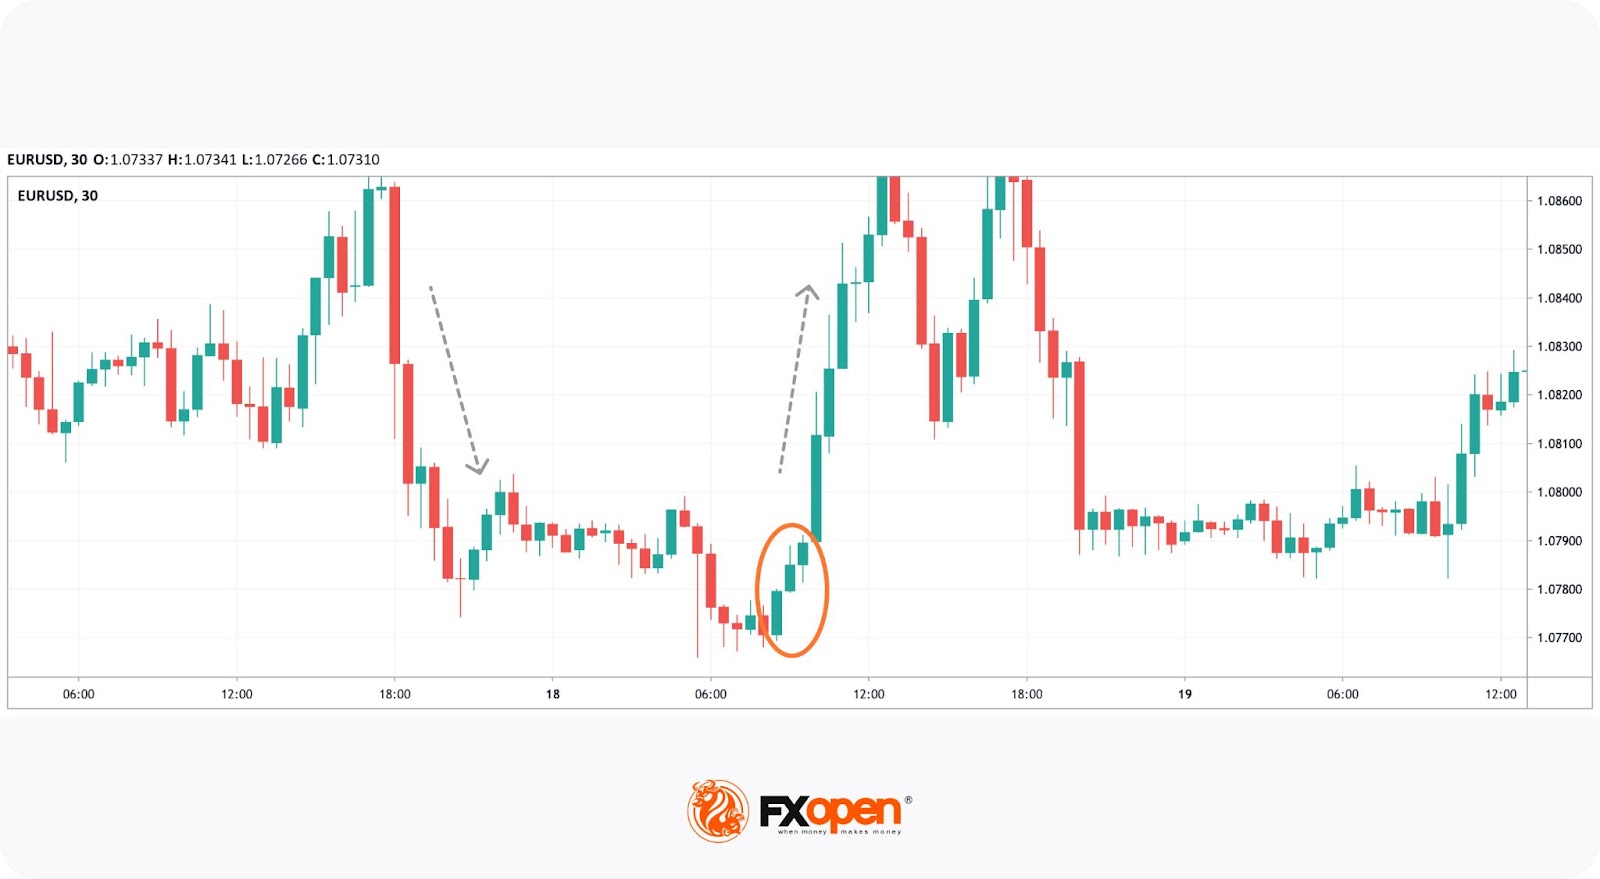
The three white soldiers pattern, also known as the three white candles or 3 green soldiers, is a bullish reversal candlestick formation that signals a potential shift from a downtrend to an uptrend. This pattern consists of three consecutive bullish candles, each with a long real body and little to no shadows. The three candles should ideally open within the previous candle's body and close progressively higher.
To correctly identify the 3 white soldiers pattern, several conditions must be met:
- Existing Downtrend: The pattern should appear after a clear downtrend, indicating that the market has been experiencing bearish sentiment.
- Three Consecutive Bullish Candles: Each candle must be bullish and should form consecutively over three periods.
- Long Real Bodies: The bodies of these candles should be relatively long, signifying strong buying momentum. Short or absent shadows (wicks) suggest that buyers controlled the market from open to close.
- Market Context: The pattern’s reliability increases when it appears during a broader context of market consolidation or at a support level, signalling a stronger potential for reversal.
When these conditions align, the three soldiers pattern provides a strong indication of a potential trend reversal from bearish to bullish. However, traders are encouraged to confirm the pattern with additional technical analysis tools, including moving averages, trendlines, Fibonacci retracements, and market data, to ensure a more accurate trading decision.
You could use the TickTrader platform to view charts and discover trading opportunities.
What Is the Difference Between 3 White Soldiers and 3 Black Crows?
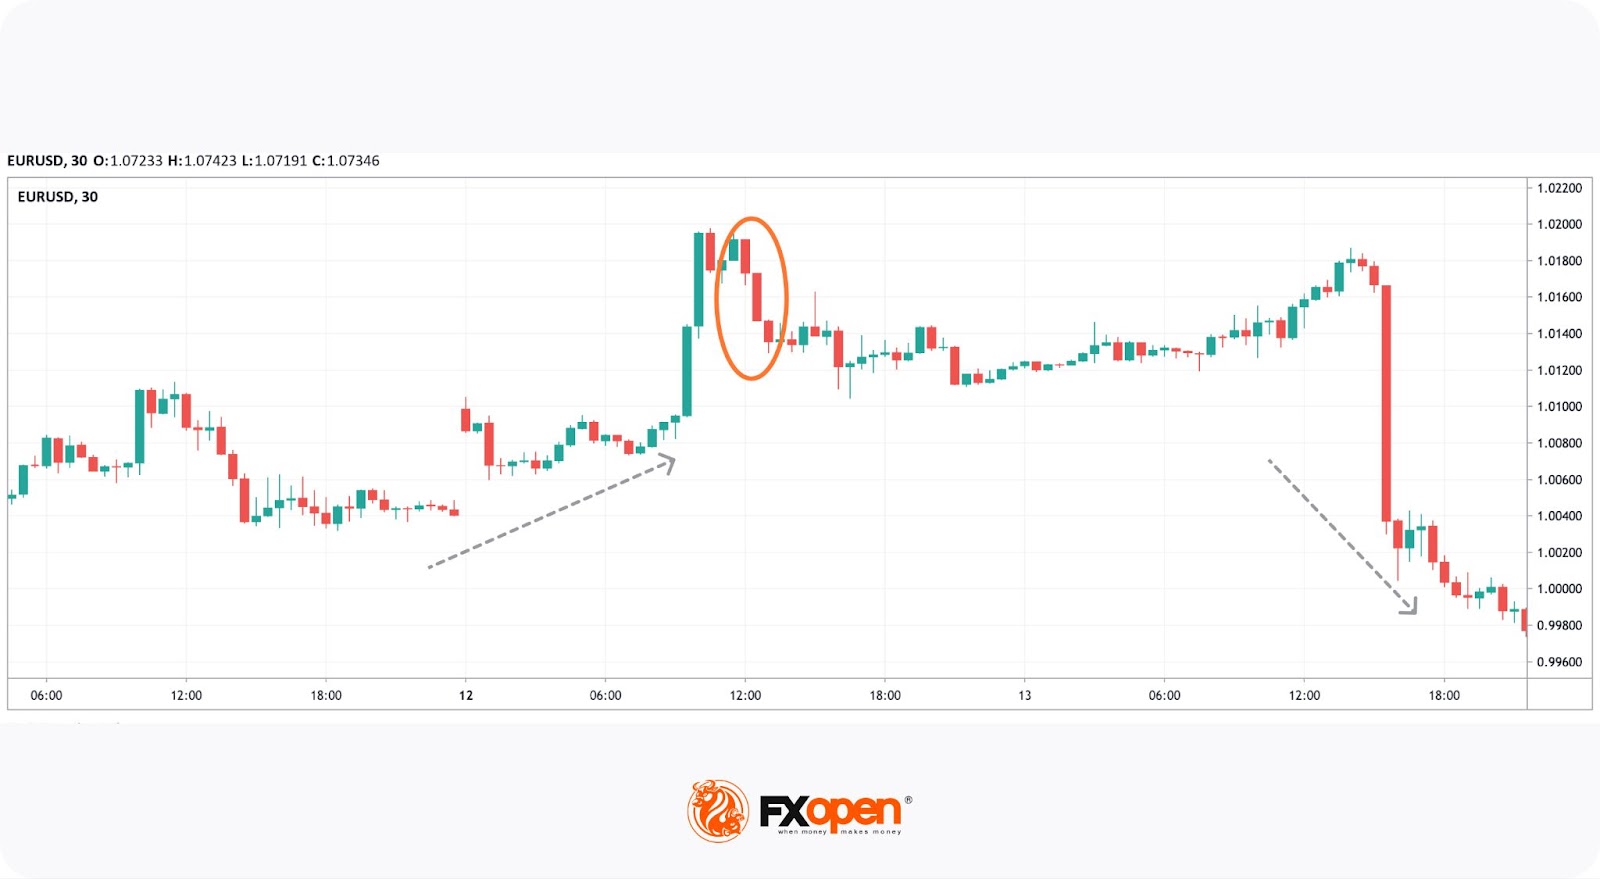
Almost every candlestick formation is represented by two versions – the one occurring in a downtrend and the other appearing in an uptrend. Three white soldiers also have a pair. The three black crows formation is the opposite of the three white soldiers. Three black crows is a bearish reversal setup formed at the end of a bullish move, composed of three consecutive long bearish candles, each opening within the previous candle's real body and closing below the previous low. It suggests strong selling pressure and a potential change in trend from bullish to bearish.
The Significance of the Three White Soldiers Pattern
The three white soldiers pattern holds significant value for traders due to its ability to indicate a potential reversal in market sentiment. However, it’s important to understand the reliability of this formation.
Market Psychology Behind the Pattern
The 3 soldiers pattern reflects a shift in market sentiment from bearish to bullish. When the 3 green soldiers form after a downtrend, it signals that buyers are gaining control, overcoming previous selling pressure. This sustained buying interest over three consecutive candles suggests a growing confidence among traders that the market has reached a bottom and is poised for a reversal, especially when the formation appears on higher timeframe charts.
Reliability of the Pattern
While the three white soldiers pattern is considered a strong bullish signal, its reliability is not absolute. The pattern's effectiveness can be influenced by factors such as overall market conditions, volume, and the presence of confirming indicators like moving averages or support levels.
In thinly traded markets, the pattern may be less reliable due to the potential for false signals. Therefore, it is crucial to use this pattern alongside other technical analysis tools to improve the accuracy of trading decisions.
Confirming the Pattern
While the three white soldiers pattern is a strong bullish indicator, it should not be relied upon in isolation. Here are some key methods for confirming the pattern:
- Volume Analysis: Traders look for increasing trading volume accompanying the three bullish candles. Higher volume suggests stronger market participation and validates the buying momentum indicated by the pattern.
- Moving Averages: It’s a good idea to check whether the pattern forms above key moving averages. A bullish crossover or a position above these indicators can further confirm a potential trend reversal.
- Support and Resistance Levels: The pattern forming near a significant support level or upon breaking through resistance can add credibility to the reversal signal.
- Momentum Indicators: Momentum oscillators should ideally be rising from an oversold region when the three white soldiers appear, indicating a shift in momentum towards buying.
- Candlestick Gaps: Gaps between the closing price of the last candle and the opening of the next can provide confluence. Bullish gaps can strengthen the signal by showing a strong shift in market sentiment.
How Can You Trade the Three White Soldiers Candlestick Pattern?
As the three white soldiers reflects a potential bullish reversal in the market, traders may choose to enter long positions.
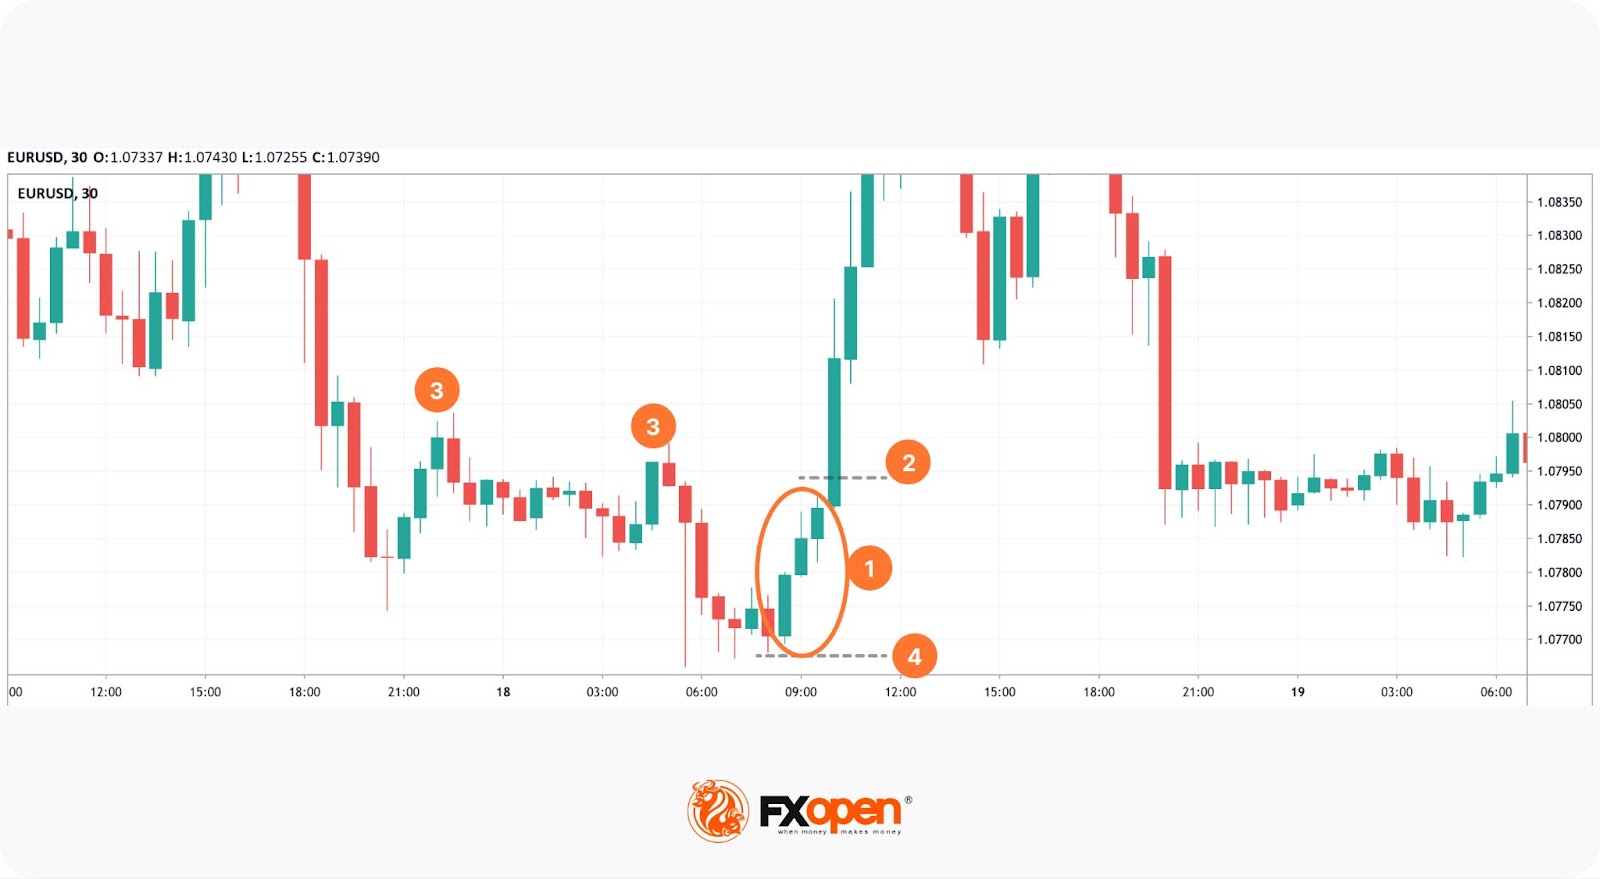
1. Identify the pattern: Look for three consecutive long bullish candles which close higher and occur after a downtrend or during market consolidation (1).
2. Determine the entry point: Once the formation is confirmed, traders place a buy order at the close of the third candle or slightly above it (2).
3. Determine the exit points: According to the theory, commonly used exit strategies when trading the three white soldiers setup involve taking profit at the next resistance level or using the trailing take profit, which allows you to lock in potential gains as the price moves in your favour. In our example, resistance levels are too close to an entry point (3); therefore, it could be better to follow the market sentiment and trail the take-profit target. Some traders place a stop-loss order below the first candle's low or the most recent significant low to potentially protect their capital (4). If you prefer to trail the take-profit target, you can move the stop-loss level accordingly.
Please note that these are just basic rules. They do not guarantee effective trading. It is important to consider other technical and fundamental factors before making a trading decision.
Common Mistakes to Avoid
When trading using the three white soldiers pattern, traders should be aware of common mistakes that can lead to false signals and losses. Here are key pitfalls to avoid:
- Ignoring Market Context: Using the pattern in isolation without considering the broader market context, such as overall trends or macroeconomic factors, can result in misleading signals. The pattern is more reliable when appearing at the end of a prolonged downtrend rather than during sideways markets or minor pullbacks.
- Overlooking Volume: Not considering trading volume can diminish the pattern's significance. Low volume during the formation may suggest weak buying pressure, making the reversal less convincing.
- Entering Trades Too Early: Impatiently entering a trade before the pattern fully forms can lead to premature decisions and potential losses. Waiting for the third candle to close confirms the pattern’s completion.
- Neglecting Confirmation Tools: Relying solely on the three white soldiers candlestick pattern without using additional trend or momentum indicators can increase the risk of encountering false signals.
- Misinterpreting Candle Size: If the candles have small bodies or significant shadows, it may indicate indecision rather than a strong bullish reversal, weakening the pattern’s reliability.
Final Thoughts
The 3 white soldiers pattern is a powerful tool for identifying bullish reversals across markets. Understanding 3 candlestick patterns like the three white soldiers in stock, forex, commodity, and cryptocurrency* trading can provide an edge; however, be sure to confirm signals with additional analysis to improve accuracy.
Ready to trade? Open an FXOpen account today to explore many opportunities across more than 600 markets and take advantage of our low-cost, high-speed trading environment.
FAQ
What Is the Difference Between 3 White Soldiers and 3 Black Crows?
The 3 white soldiers pattern signals a bullish reversal after a downtrend, while the 3 black crows pattern indicates a bearish reversal after an uptrend. The former consists of three consecutive bullish candles, while the latter includes three consecutive bearish candlesticks.
How Accurate Is the Three White Soldiers Pattern?
The three white soldiers pattern is generally considered reliable, especially when confirmed with other indicators. However, its accuracy can vary based on market conditions, so it should not be used in isolation.
*At FXOpen UK and FXOpen AU, Cryptocurrency CFDs are only available for trading by those clients categorised as Professional clients under FCA Rules and Professional clients under ASIC Rules, respectively. They are not available for trading by Retail clients.
This article represents the opinion of the Companies operating under the FXOpen brand only. It is not to be construed as an offer, solicitation, or recommendation with respect to products and services provided by the Companies operating under the FXOpen brand, nor is it to be considered financial advice.
Stay ahead of the market!
Subscribe now to our mailing list and receive the latest market news and insights delivered directly to your inbox.


Latest articles

GBP/USD and EUR/GBP Await Key Bank of England Decision
The pound strengthened following the outcome of the US Federal Reserve meeting, where the central bank, as expected, kept interest rates unchanged. However, the Fed did not provide the market with clear signals of an imminent shift towards rate cuts,

Microsoft Analysis: Earnings Beat Expectations
On 29 July 2026, Microsoft reported its results for the fourth quarter of fiscal year 2026. Revenue reached $90 billion, up 18% year-on-year, while adjusted earnings per share came in at $4.74, comfortably ahead of analysts' expectations of $4.

EUR/USD: All Eyes on the Fed as the Range Reaches Its Breaking Point
The dollar's next move hinges on tonight's Fed decision, and this time markets genuinely don't know what to expect. While economists still lean toward a hold—with CME FedWatch odds sitting near 68.5% for no change—Kevin Warsh's hawkish