


How to Trade with the Chande Momentum Oscillator
FXOpen
Oscillators are popular tools in trading, and the Chande Momentum Oscillator is no exception. In this article, we will cover the unique insights offered by this indicator, how it’s calculated, and how it stacks up with other well-renowned momentum tools.
What Is the Chande Momentum Oscillator Indicator?

The Chande Momentum Oscillator (CMO) is a technical analysis tool developed by Tushar Chande. It quantifies the momentum of a financial instrument by comparing the sum of its higher closes to the sum of its lower closes over a set period.
Unlike other oscillators that fluctuate between 0 and 100, the CMO oscillates between -100 and +100. Values above zero signify upward strength, while those below zero indicate downward strength. Designed to capture the inherent volatility of an asset, it assists traders in identifying potential overbought or oversold conditions and potential price reversals.
How to Calculate the Chande Momentum Oscillator
To calculate the CMO, the primary elements to consider are higher and lower closes over a specified period.
1. Determine Up and Down Periods:
- An "Up Period" refers to when the current close is higher than the previous period's close. The difference in closing prices for these periods gives the “Higher Closes” value.
- Conversely, a "Down Period" is when the current close is lower than the previous period's close. The “Lower Closes” value is the difference between these two data points.
2. Apply the Chande Momentum Oscillator Formula:
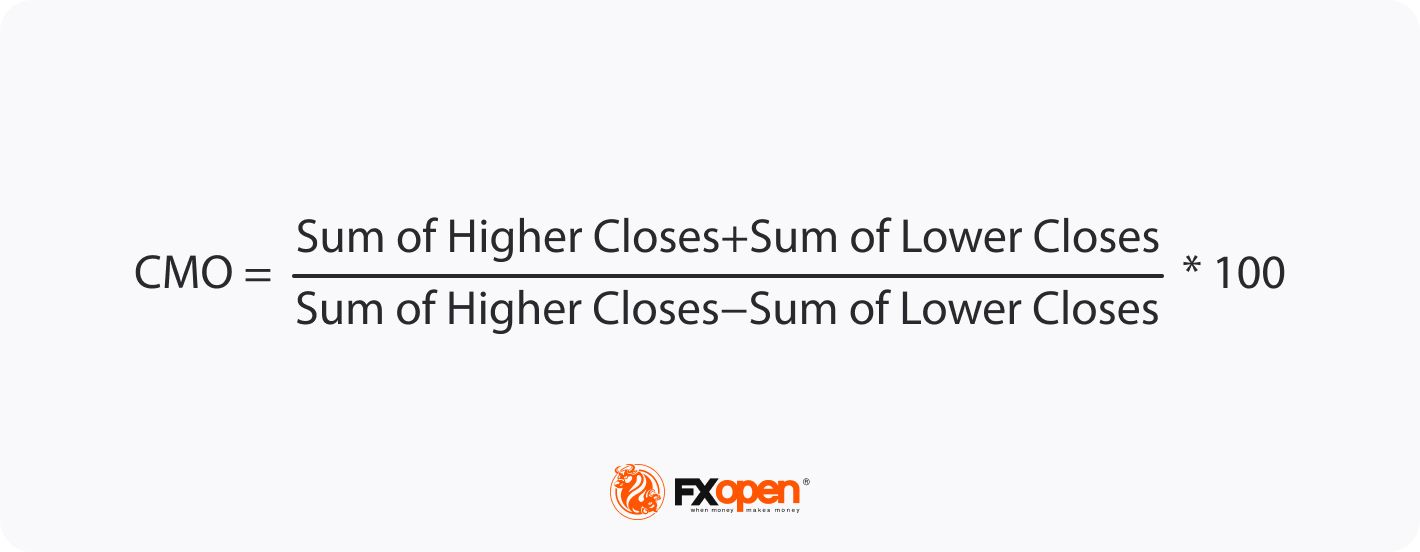
It's typical to use 9 periods for the CMO, but traders can adjust this based on their preferences or the asset's volatility.
In FXOpen’s free TickTrader platform, we have the Chande Momentum Oscillator script built in. You can head over to the terminal to start using the CMO in minutes.
How to Use the Chande Momentum Oscillator
Once the CMO is calculated, interpreting its readings becomes pivotal for trading decisions. Here's a theory on how to utilise it:

Interpreting Momentum:
- Values above zero signal upward force. The further the line is from zero on the positive side, the stronger the upward velocity.
- Values below zero represent downward velocity. A more negative value suggests a stronger downward trend.
Overbought and Oversold Indicators:
- Readings nearing +100 typically indicate overbought conditions, implying a potential reversal or slowdown in the upward trend.
- Conversely, values approaching -100 can signal oversold conditions, hinting at a possible upward reversal or deceleration in the downward movement.
Zero Line Crossover:
- A crossover of the zero line can signify a change in price direction, providing traders with a potential entry or exit point.
The Chande Momentum Oscillator vs the Stochastic Oscillator

Both the CMO and the Stochastic Oscillator are valuable tools in technical analysis, aiding traders in gauging market strength. The CMO, as discussed, oscillates between -100 and +100, emphasising the difference between higher and lower closes over a given period.
On the other hand, the Stochastic Oscillator moves between 0 and 100 and evaluates where the current price is relative to a range over a specified timeframe. It also commonly features a signal line.
However, a shared limitation of both these indicators is the potential for false signals. Therefore, it's crucial for traders to corroborate such signals with other tools or indicators to achieve a more holistic and accurate trading perspective.
The Bottom Line
In summary, the CMO provides traders with a nuanced perspective of market strength and is a solid alternative to similar indicators, like the RSI or Stochastic. Of course, it’s often best to incorporate this indicator with other tools to mitigate the chance of false signals and create a well-rounded strategy. Once you have developed your strategy, you can open an FXOpen account to put your skills to the test across a huge range of markets. Happy trading!
This article represents the opinion of the Companies operating under the FXOpen brand only. It is not to be construed as an offer, solicitation, or recommendation with respect to products and services provided by the Companies operating under the FXOpen brand, nor is it to be considered financial advice.
Stay ahead of the market!
Subscribe now to our mailing list and receive the latest market news and insights delivered directly to your inbox.


Latest articles

EUR/USD Analysis: Who Is in Control?
Two central banks, two hawkish tones — but only one dollar just took a hit. The ECB delivered a 25bp hike in June, its first since 2023, lifting the deposit rate to 2.25% as Middle East-driven energy costs pushed headline

Gold Resumes Its Advance Following the US Labour Market Report
Gold is attempting to break its medium-term trend, with the latest US labour market data acting as the main catalyst. The US employment report released on 2 July came in noticeably weaker than expected, with the pace of hiring slowing

NZD/CHF Analysis: Which Currency Breaks the Consolidation First?
NZD/CHF remains locked in a tight range as traders await the next monetary policy catalyst.
The Reserve Bank of New Zealand heads into Wednesday's meeting on shaky ground. After May's 3-3 split was resolved by a casting vote, the