


Understanding Fibonacci Extensions
FXOpen
Have you ever noticed that market movements often occur in repeatable patterns? Well, that’s where Fibonacci extensions come into play. Join us in this article as we dive into the world of Fibonacci extensions and discover how they can be a strong addition to your trading arsenal.
A Primer on Fibonacci Ratios
Fibonacci ratios originate from the Fibonacci sequence, where each number is the sum of the two preceding ones (e.g., 0, 1, 1, 2, 3, 5, 8, 13, 21, 34). The key ratio, known as the Golden Ratio, is approximately 1.618. This is calculated by dividing a number in the sequence by its immediate predecessor (e.g., 34 ÷ 21 ≈ 1.619). Conversely, dividing a number by the next number yields approximately 0.618 (e.g., 21 ÷ 34 ≈ 0.618).
In trading, these ratios are used to identify potential support and resistance levels through Fibonacci retracements and extensions:
- Fibonacci Retracements. These indicate where the price might pull back within an existing trend. Common retracement levels are 23.6%, 38.2%, 50%, 61.8%, and 78.6%. They are derived from the ratios between numbers in the sequence and are applied to measure potential correction points.
- Fibonacci Extensions. These project potential price targets beyond the current range. Key extension levels include 100%, 161.8%, 200%, 261.8%, and 423.6%. They are calculated by extending the Fibonacci ratios past the 100% level to anticipate where the price might move following a retracement.
Note that these ratios can be expressed as either integers or percentages, e.g. 0.618 or 61.8%.

What Are Fibonacci Extensions?
Fibonacci extensions (also known as Fibonacci expansions or Fib extensions) are a technical analysis tool that allows traders to determine potential levels of support and resistance for an asset’s price. Like regular support and resistance levels, they are considered as areas of interest rather than where the price will turn with pinpoint precision. They’re most frequently used to set profit targets, although they can also be used to find entries.
Fibonacci extensions can be applied to any market, including forex, commodities, stocks, cryptocurrencies*, and more, and work across all timeframes. While not foolproof, using the Fibonacci extension tool combined with other forms of technical analysis might be an effective way to spot potential reversal points in financial markets.
Fibonacci Retracements vs. Extensions
Both Fibonacci retracements and extensions are based on the Fibonacci sequence and the Golden Ratio, but they are used to measure different things in the market. The former shows support and resistance levels during a pullback from a larger move. The latter measures the potential levels of support and resistance for an asset's price after a pullback has occurred.
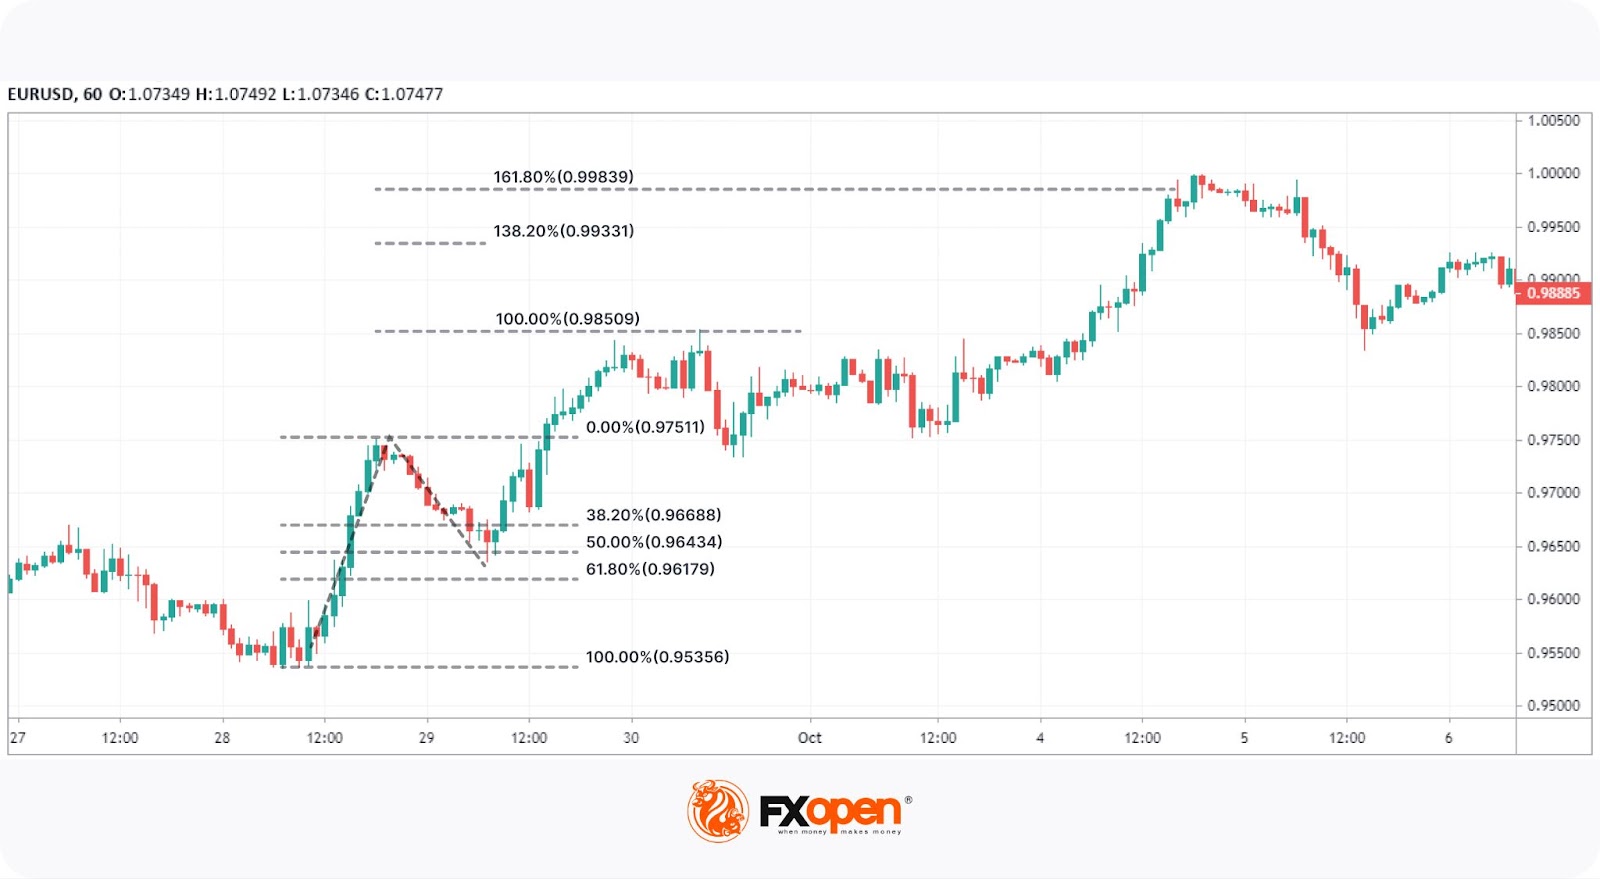
As shown in the chart above, the Fibonacci retracement tool can be applied to identify where the price may pull back to – 50% in this scenario. Then, the Fibonacci extension tool is used to plot where the price could end up beyond this pullback. The 100% and 161.8% levels posed significant resistance, causing the price to reverse.
It’s easy to see how both tools can be used in conjunction to build a strategy. Generally speaking, traders tend to enter on a pullback to one of the key retracement levels, and then take potential profits at the extension levels. However, either tool can be used to find areas suitable for entries and exits.
Fib Extensions: How to Use Them in a Trading Strategy
If you’re wondering how to use Fib extensions in your own trading, here are the steps you need to follow. To get the best understanding, use the trend-based Fib extension tool found on the TickTrader platform by FXOpen to apply each step.
- Click to set the first point at a major swing low if expecting bullishness or swing high if expecting bearishness. Using the Magnet mode on TickTrader may help you set it with precision.
- Place the second point at a swing in the opposite direction.
- Put the third point at the low of the pullback if a bullish move is expected or the high if a bearish move is expected.
That’s it! You now have an idea of where price may reverse as the trend progresses, allowing you to set profit targets or plan entries. You can also double-click the tool to adjust it to your preferences, like removing certain levels and changing colours.
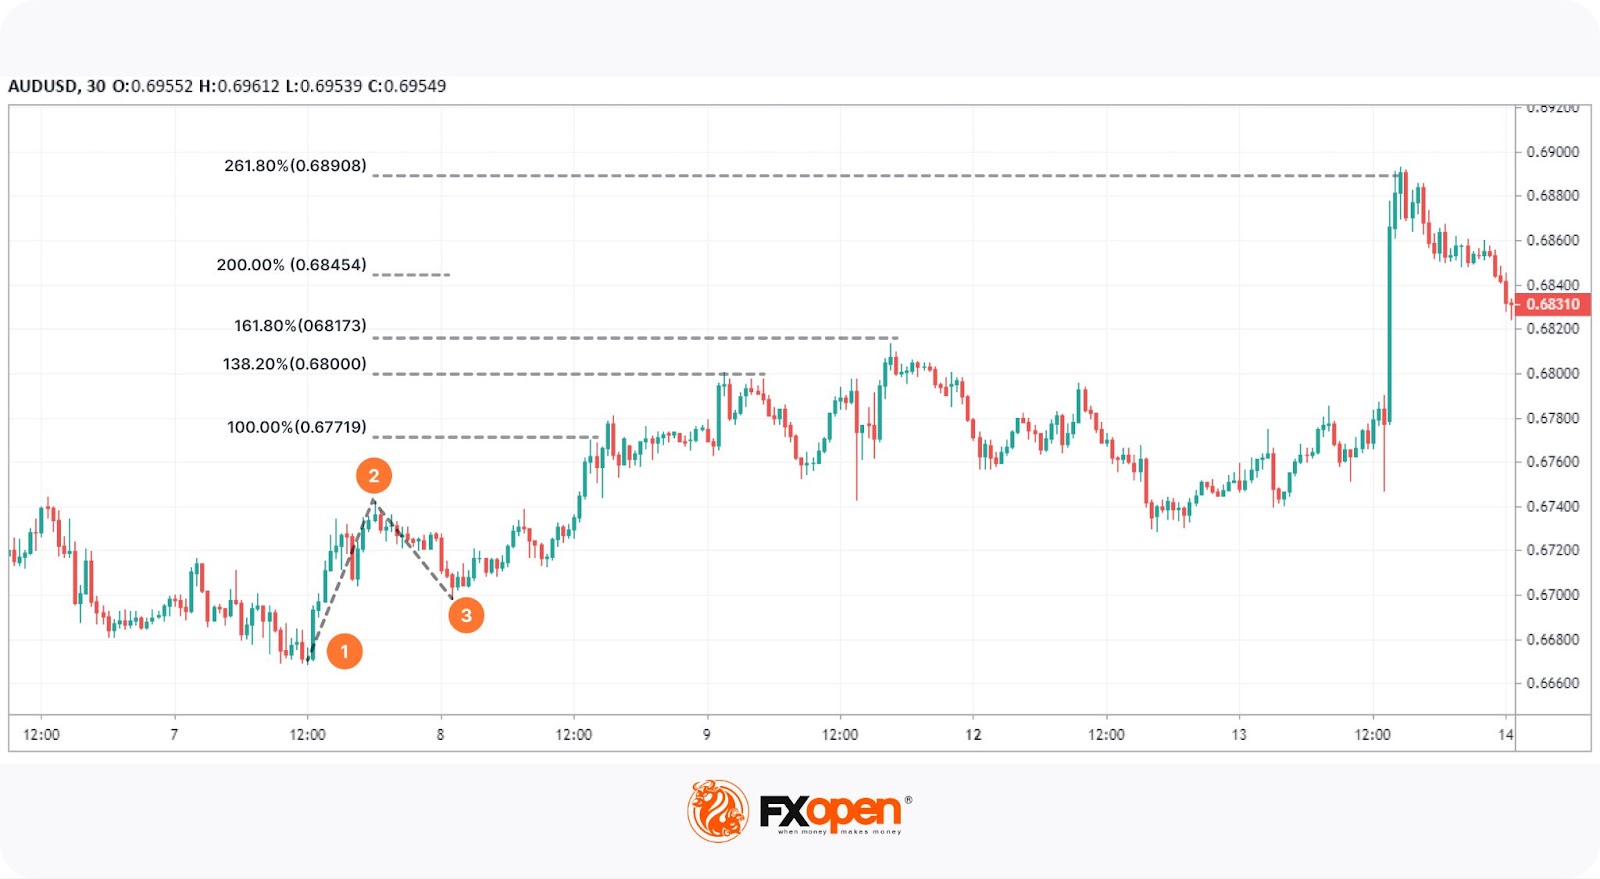
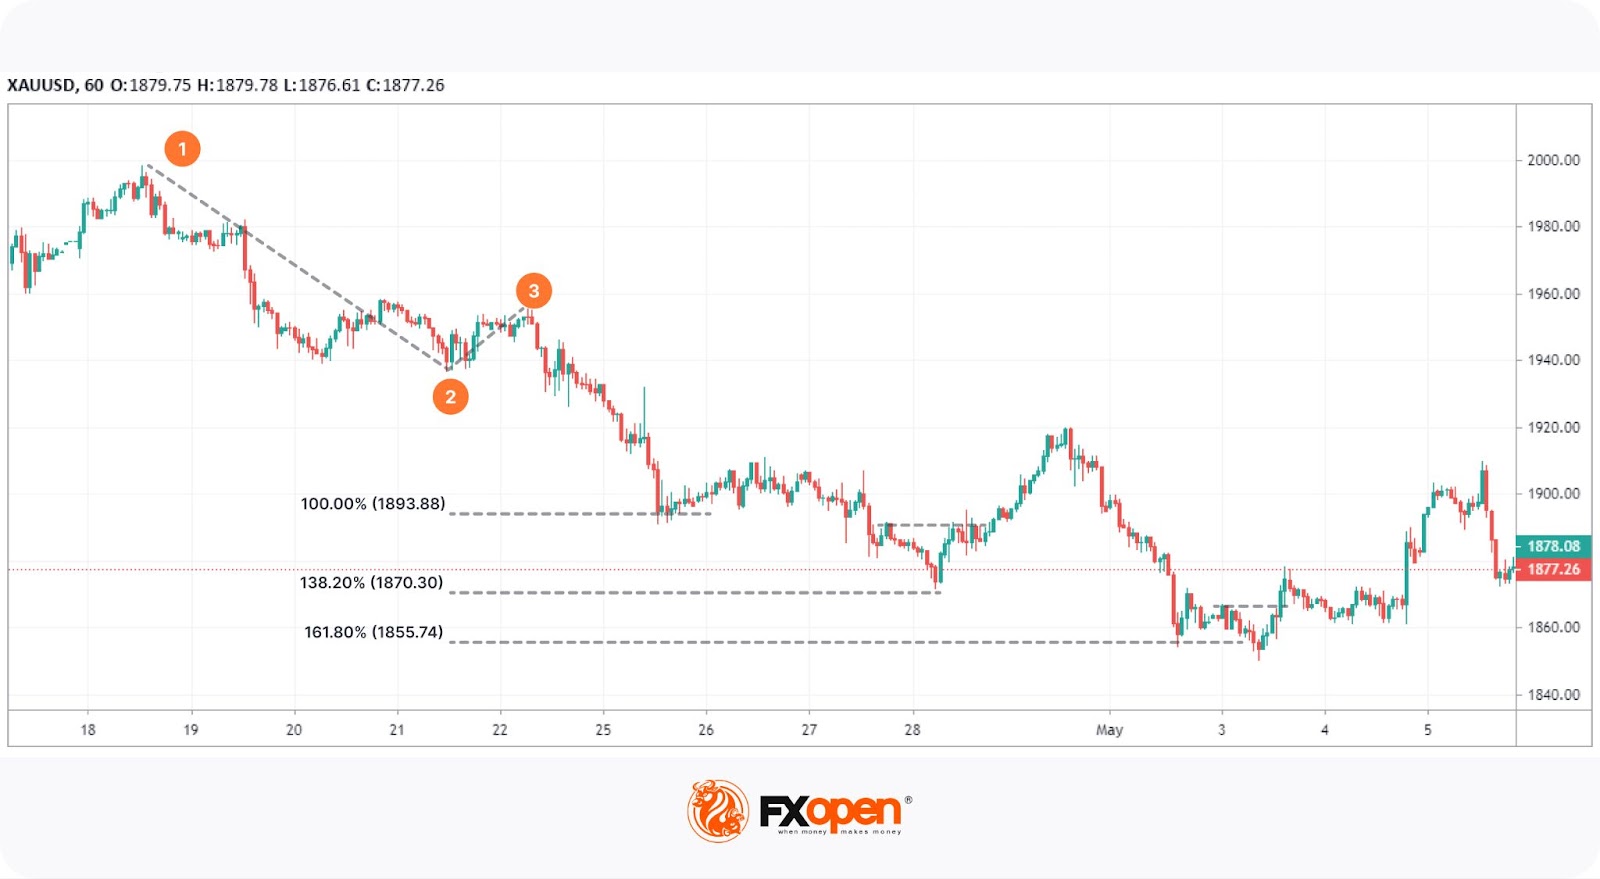
Bullish Example
In this example, we have a swing low (1) followed by a swing high (2) that makes a retracement (3). These three points are all we need to plot a Fibonacci extension. Notice that the 138.2% level didn’t hold, showing that price isn’t always guaranteed to reverse in these areas. However, the wicks and sustained moves lower at the 100% and 161.8% areas gave traders confirmation that a reversal might be inbound.
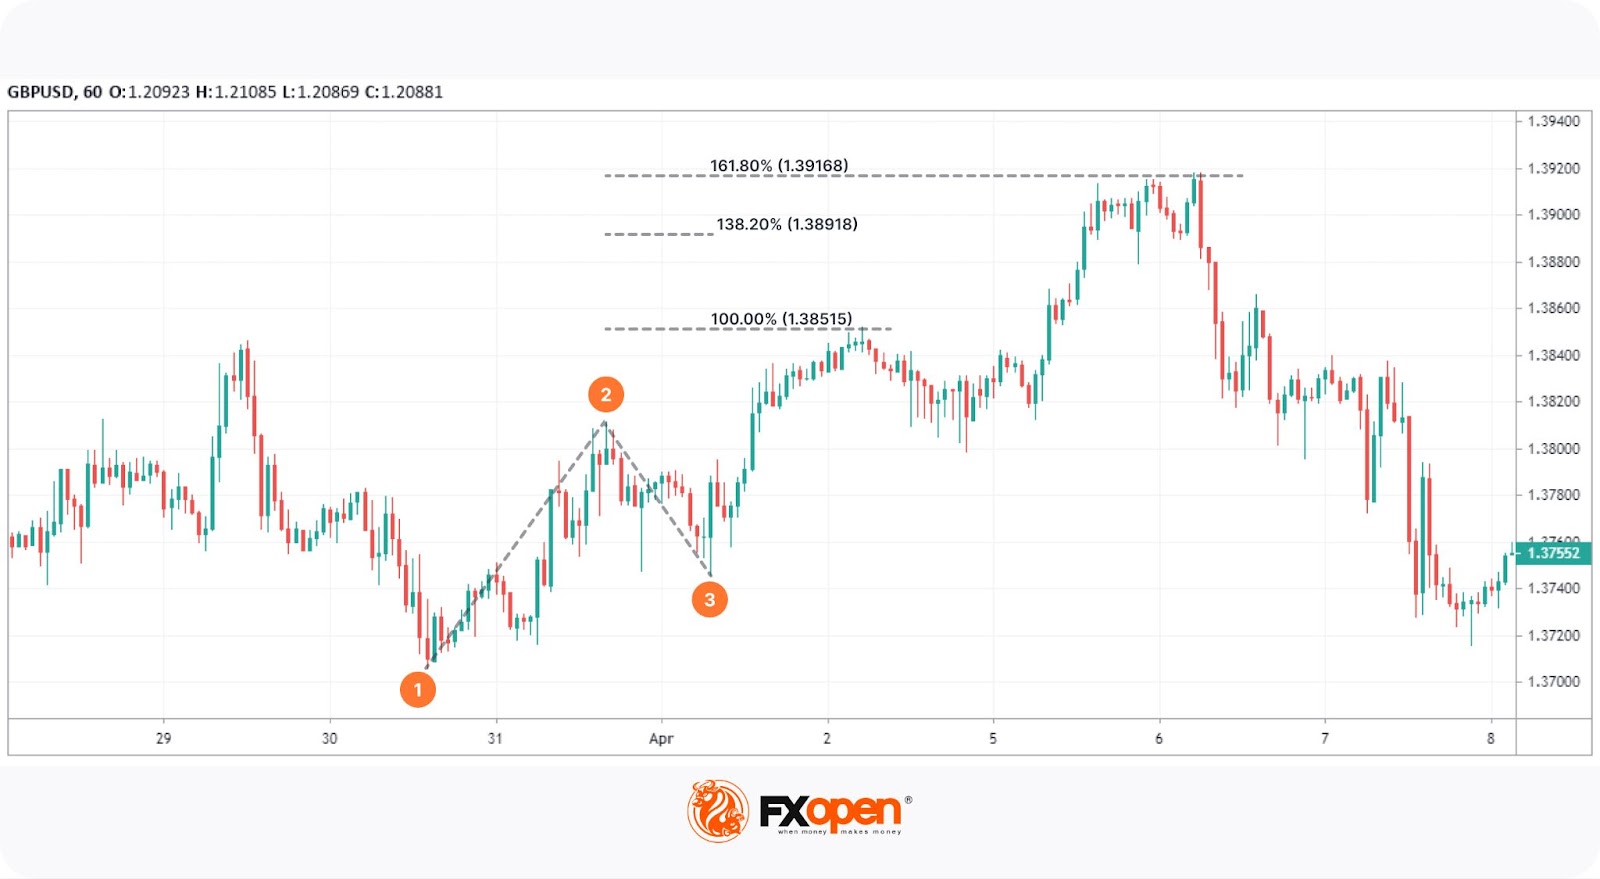
Bearish Example
Here, we can see that each of the three areas prompted a pullback. Some traders might not consider the 138.2% area valid to trade. However, the most common way to get around this is to look for confirmation with a break of the trend, as denoted by the dotted line between extensions. Once the price gets beyond that swing high (intermittently breaking the downtrend), traders have confirmation that what they’re looking at is likely the start of a reversal.
Some traders believe that if the price closes beyond a level, it’ll continue progressing to the next area. While this can sometimes be the case, it can just as easily reverse. Here, the price briefly closed below the 161.8% level before continuing much higher.
How Can You Confirm Fib Extensions?
While Fibonacci extensions suggest potential areas where price movements may reverse or stall, traders often seek additional confirmation to enhance their confidence in these levels. Here are some methods traders typically use to validate Fib extension levels.
- Confluence with Other Fibonacci Levels. Traders can look for alignment between Fibonacci extensions and retracements from different timeframes or price swings. This overlap may indicate a more significant level where the price could react.
- Support and Resistance Zones. If a Fibonacci extension level coincides with established support or resistance areas on the chart, it can reinforce the likelihood of a market response at that point.
- Candlestick Patterns. Observing specific candlestick formations, such as doji, hammer, or engulfing patterns at Fibonacci extensions, can provide insights into potential reversals or continuations.
- Technical Indicators. Incorporating indicators like moving averages, RSI, or MACD can help confirm the validity of a Fibonacci extension level. For example, if the RSI indicates overbought conditions at a key extension level, traders might anticipate a pullback.
- Trendlines and Chart Patterns. Aligning Fibonacci extensions with trendlines or chart patterns like the Head and Shoulders can offer additional confirmation. Traders often find that extension levels intersecting with these tools carry more significance.
- Volume Analysis. An increase in trading volume near a Fibonacci extension level may suggest stronger market interest, potentially validating the importance of that level.
- Multiple Timeframe Analysis. Traders might analyse Fibonacci extensions across various timeframes to identify consistent levels of interest. A level that appears significant on both charts could be considered more reliable.
- Market Sentiment and News Events. While primarily technical, acknowledging fundamental factors such as economic news or market sentiment can help traders assess whether a Fibonacci extension level might hold or be surpassed.
Limitations of Fibonacci Extensions
Fibonacci extensions are valuable for projecting potential price targets, but they come with limitations that traders should consider. Understanding these can lead to more informed use within a trading strategy.
- Lack of Confidence in Price Movements. While based on mathematical ratios, Fibonacci extensions don't account for unexpected market events like economic news or geopolitical developments that can significantly impact prices.
- Subjectivity in Point Selection. The effectiveness of extension levels hinges on correctly identifying swing highs and lows. Different traders may choose varying reference points, leading to inconsistent levels and interpretations.
- Ineffectiveness in Certain Market Conditions. In sideways or highly volatile markets, prices may not respect Fib extensions, reducing their reliability as indicators of support or resistance.
- Conflicting Signals Across Timeframes. Extension levels vary between different timeframes, potentially causing confusion and conflicting signals in analysis and decision-making.
- Overreliance on Technicals. Focusing solely on Fib extensions might cause traders to overlook other critical technical indicators or fundamental factors influencing the market.
- Unnatural Price Movements. Widespread use of Fibonacci levels can lead to price reactions simply because many traders expect them, creating artificial support or resistance that may not hold.
- Psychological Biases. Traders might experience confirmation bias, seeing what they expect at Fib levels, which can lead to misguided trading decisions.
Making the Most of Fibonacci Extensions
By now, you may have a decent understanding of what Fib extensions are and how to use them. But how do you make the most out of Fibonacci extensions? Here are two points you may consider to improve your trading strategy.
- Look for confirmation. Instead of blindly setting orders at extension levels, you can look for price action confirmation that the price is starting to reverse at the area before taking potential profits or entering a position. You could do this by looking for breaks in the trend, as discussed in the example above.
- Find confluence. Similarly, you can use other technical analysis tools like trendlines, indicators like moving averages, or even multiple Fibonacci extensions, to give you a better idea of how price will likely react at a level.
Your Next Steps
Now, it’s time to put your understanding to the test. Spend some time practising how to use Fibonacci extensions and try backtesting a few setups to see how you could get involved in a trade. Once you feel you have a solid strategy, open an FXOpen account to start using your skills in the live market. In the meantime, why not try exploring other Fibonacci-related concepts, like Fibonacci retracements and harmonic patterns? Good luck!
FAQ
How Can You Use Fibonacci Extensions?
Fibonacci extensions help traders identify potential future support and resistance levels beyond the current price range. To use them, traders select three points: the start of a trend, its end, and the retracement point. They then apply the Fibonacci extension tool to project where the price may move following a retracement.
How Should You Draw Fibonacci Extensions?
The process starts with choosing the trend-based Fib extension tool in your charting software. Then, the next step is to select the swing low/high (start of the trend), then the swing high/low (end of the trend), and finally the retracement low/high. The tool will display extension levels indicating possible future price targets.
What Is the Difference Between Fibonacci Retracements and Extensions?
Fibonacci retracements identify potential support and resistance levels during a price pullback within an existing trend. Extensions, on the other hand, project levels beyond the current price range, indicating where the price might move after the retracement. Retracements focus on corrections; extensions focus on trend continuations.
*At FXOpen UK, Cryptocurrency CFDs are only available for trading by those clients categorised as Professional clients under FCA Rules. They are not available for trading by Retail clients.
This article represents the opinion of the Companies operating under the FXOpen brand only. It is not to be construed as an offer, solicitation, or recommendation with respect to products and services provided by the Companies operating under the FXOpen brand, nor is it to be considered financial advice.
Stay ahead of the market!
Subscribe now to our mailing list and receive the latest market news and insights delivered directly to your inbox.


Latest articles

Amazon Analysis: Strong Earnings Coincide with a Breakout from the Correction
On 30 July, Amazon.com reported its financial results for the second quarter of 2026, significantly exceeding market expectations. Revenue rose 20% year-on-year to $200.6 billion, compared with the consensus forecast of around $196.5 billion. The main growth

GBP/USD and EUR/GBP Await Key Bank of England Decision
The pound strengthened following the outcome of the US Federal Reserve meeting, where the central bank, as expected, kept interest rates unchanged. However, the Fed did not provide the market with clear signals of an imminent shift towards rate cuts,

Microsoft Analysis: Earnings Beat Expectations
On 29 July 2026, Microsoft reported its results for the fourth quarter of fiscal year 2026. Revenue reached $90 billion, up 18% year-on-year, while adjusted earnings per share came in at $4.74, comfortably ahead of analysts' expectations of $4.