


How to Identify and Trade Harmonic Patterns
FXOpen

Harmonic chart patterns are a form of technical analysis that uses specific geometric relationships between price and time to identify potential reversal points in the market. These patterns are based on the idea that Fibonacci ratios correspond to critical areas of support and resistance.
When trading Forex, harmonic patterns can be used to find pin-point entries that have the potential to offer an excellent risk/reward balance. Harmonic stock patterns are also commonly used; in fact, these patterns originated in H.M Gartley’s 1932 book Profits in the Stock Market.
What Are Fibonacci Ratios?
Harmonic trading patterns use the Fibonacci ratio, also referred to as the golden ratio. According to the Fibonacci sequence, each number following 0 and 1 equals the sum of the two previous numbers. This produces the following series: 0, 1, 1, 2, 3, 5, 8, 13, 21, 34, etc.
Each number is approximately 61.8% of the next number, then 38.2% of the following. It also produces complementary ratios of 23.6%, 50%, 78.6%, and 88.6%. When trading, these numbers are commonly expressed as decimals, like 0.618 or 0.382.
How to Identify Harmonic Patterns
Harmonic patterns can be identified in several ways. Some prefer to use a harmonic patterns indicator, which automatically shows patterns in a given market. Harmonic pattern indicators are useful for traders looking for a quick way to identify these patterns but are known to generate false signals.
Others use scanners, which survey the market for harmonic setups. How accurate is the harmonic scanner? That depends. A scanner’s accuracy is determined by its algorithm and it won’t be 100% precise. Ultimately, it’s always wise to manually verify opportunities presented by any market scanner.
Visually, harmonic patterns typically consist of five points (denoted by X, A, B, C, and D), four connecting lines, and three turning points. The first line linking X and A is the XA leg. The reversal of point A to point B forms the AB leg. Another retracement creates point C and generates the BC leg. Finally, point C leads to D, which is an entry point. This creates the bullish M or bearish W-shaped structures typical of these patterns.
The Top Harmonic Patterns for Forex Trading
Now that we have a basic understanding of harmonic patterns and how to identify them, it’s time to examine effective harmonic patterns for Forex trading. Note that the values won't always line up perfectly, so some slight variance is acceptable. Want to follow along? Use the TickTrader trading platform at FXOpen to gain access to a comprehensive suite of charting tools.
The Gartley
The Gartley pattern was the pioneer when it comes to harmonic setups. It has two key conditions that must be met:
- B is a 0.618 retracement of XA.
- D is a 0.786 retracement of XA.
Additionally:
- The BC leg retraces AB by 0.382 to 0.886.
- The CD leg extends BC by 1.13 to 1.618.
With a bullish Gartley, traders typically set a buy order at D with a stop slightly below. For a bearish Gartley, they usually set a sell order at D with a stop slightly above. Profits are often taken at C.
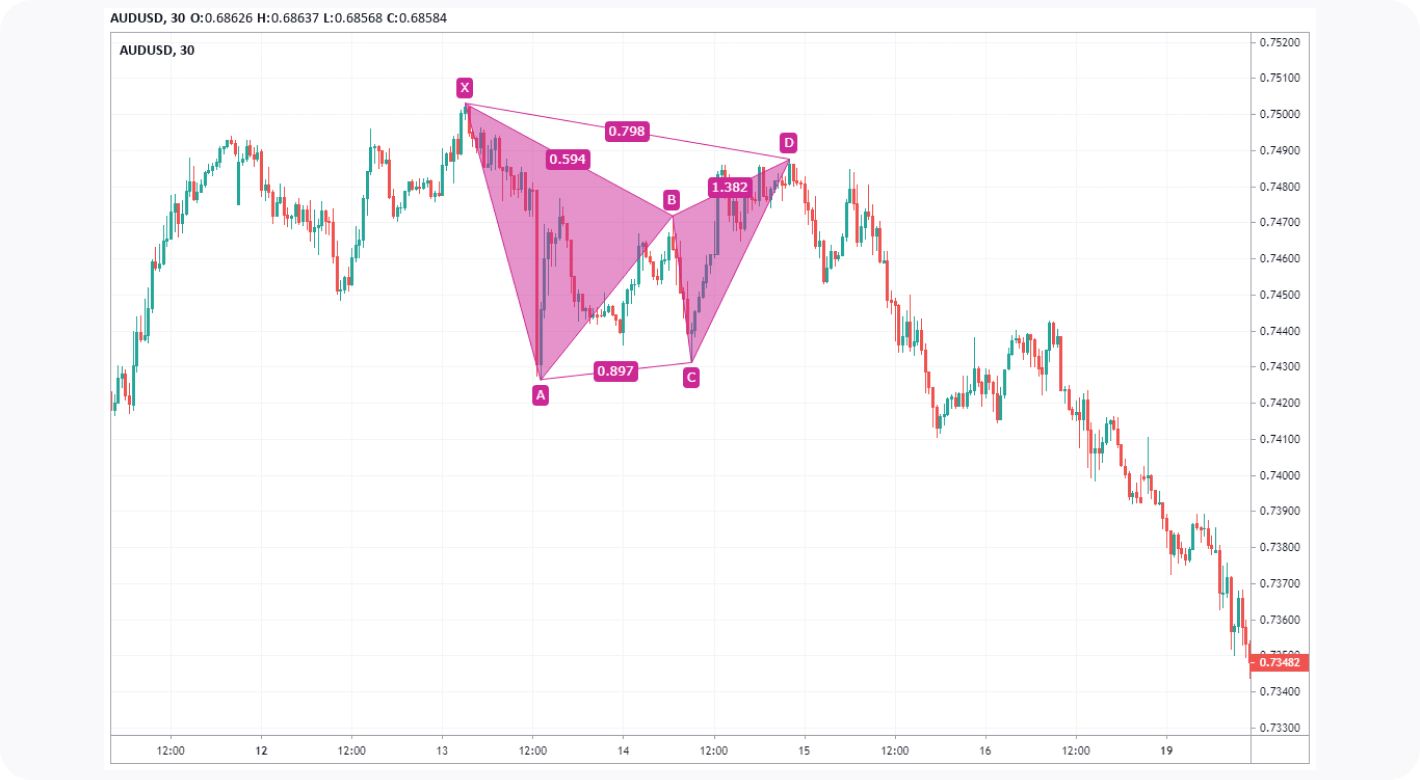
The BAT
The BAT closely resembles the Gartley pattern. For a BAT to be valid, the following must be present:
- B retraces XA by 0.382 to 0.5.
- The BC leg retraces AB by 0.382 to 0.886.
- The CD leg extends AB by 1.618 to 2.618.
- D retraces XA by 0.886.
The strategy suggests traders set a buy or sell order at D, depending on whether the pattern is bullish or bearish, with a stop above or below X. You could use C as a key place to start taking profits.
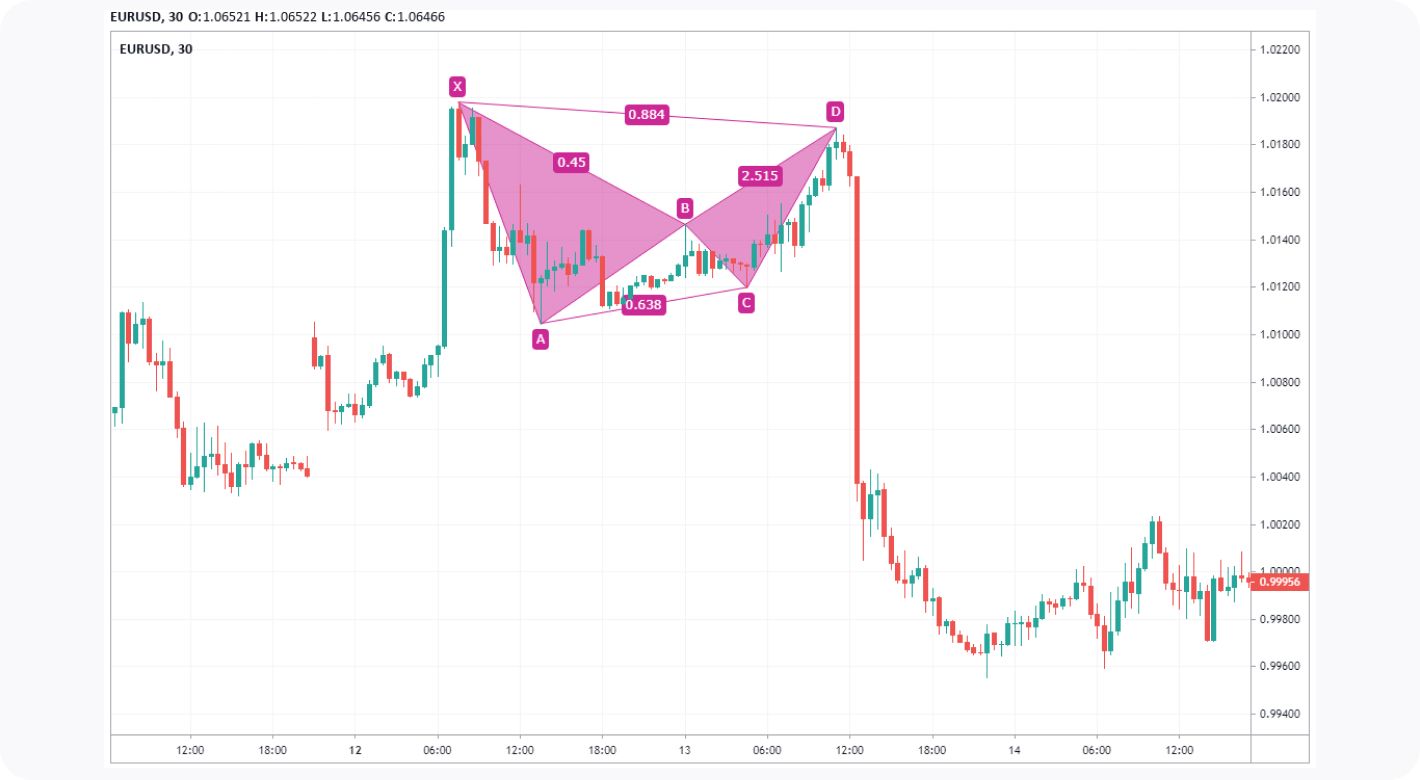
The Butterfly
The Butterfly pattern is another sibling of the Gartley, except that D exceeds X.. The Butterfly requires that:
- B retraces XA by 0.786.
- BC retraces AB by 0.382 to 0.886.
- CD extends AB by 1.618 to 2.24.
- D extends XA by 1.27.
You could enter with a buy or sell order at D. Since D already extends X, stop loss placement with the Butterfly can be tricky. You may try using a 1.618 extension of the XA leg if you’re in doubt. Partial profits could be taken at C.
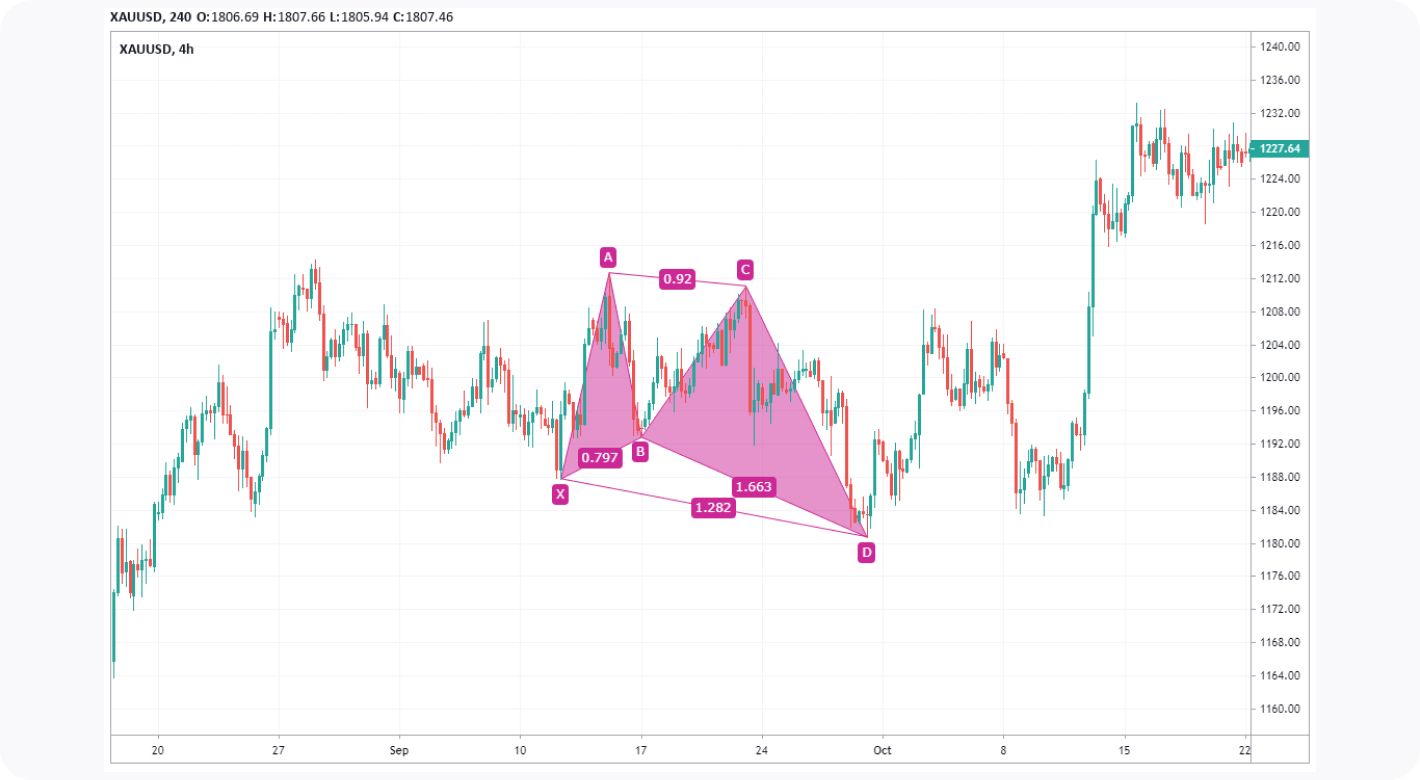
The Crab

The Crab is a favourite pattern for many traders because it has the potential to offer excellent risk/reward when correctly traded. It allows traders to enter at extreme highs and lows when:
- B retraces XA by 0.382 to 0.618.
- BC retraces AB by 0.382 to 0.886.
- CD extends AB by 2.618 to 3.618.
- D extends XA by 1.618.
As with the other patterns, D may be your entry point. Like the Butterfly, D already exceeds X, so you may need to get creative with the stop placement. You might set a stop at the 1.886 extension of the XA leg or use indicators to find an appropriate area. Given how far D extends XA, taking partial profits at B could be suitable.
How to Get Started with Trading Harmonics
Wondering where to go from here? These steps could help you:
1. You can read up on harmonic patterns and settle on a couple you’d like to study.
2. You can try a free demo account at FXOpen to practice identifying entries.
3. To begin backtesting your setups and logging the results, you could use the TickTrader platform.
This article represents the opinion of the Companies operating under the FXOpen brand only. It is not to be construed as an offer, solicitation, or recommendation with respect to products and services provided by the Companies operating under the FXOpen brand, nor is it to be considered financial advice.
Stay ahead of the market!
Subscribe now to our mailing list and receive the latest market news and insights delivered directly to your inbox.

Latest articles

US Dollar Index: A Defining Week for the King of the Markets
The dollar heads into a pivotal week trading near 101.80, just off a 15-month high, with the Fed's July 29 meeting standing as the clear focal point. Markets currently price roughly a 65% chance of a hold, though renewed

NZD/USD: Inflation Surge Meets Strong US Dollar Pressure
On 21 July, Stats NZ reported an acceleration in inflation: the Consumer Price Index rose 1.5% in the second quarter, while the annual inflation rate climbed to 4.1%, its highest level in more than two years and slightly

Weekly Market Insights with Gary Thomson: The Week of Central Banks and Earnings
In this video, we’ll explore the key economic events and market trends, shaping the financial landscape. Get ready for insights into financial markets to help you navigate the week ahead. Let’s dive in!
In this episode of Market