


How to Use MACD in Crypto Trading?
FXOpen

The crypto market is known for its volatility and complexity, often requiring the use of technical indicators to decipher price action. One of the preferred indicators amongst many crypto traders is the MACD. In this FXOpen article, we’ll delve into the MACD indicator, how it’s calculated, and how to use it for crypto trading.
What Is the MACD in Crypto?

The Moving Average Convergence Divergence, typically abbreviated as MACD, is a trend-following momentum oscillator that shows the relationship between two moving averages of an asset’s price. Developed by Gerald Appel in the late 1970s, it helps traders assess a trend’s direction and strength and identify potential reversals in the market.
The MACD is a popular tool used in various financial instruments, not just crypto. However, many crypto traders favour its ability to help them understand momentum – which is essential when navigating volatile crypto markets.
How Is the MACD Calculated?
The calculation of the MACD is relatively simple, revolving around the concept of EMAs. An EMA (exponential moving average) is a type of moving average that gives more weight to recent prices, making it more responsive to new price data. This contrasts to the most basic form of moving average, a simple moving average (SMA), which gives equal weight to its input data.
First, two EMAs are calculated. Typically, these are 12-period and 26-period EMAs of the asset's price. The shorter 12-period EMA reacts more quickly to price changes than the longer 26-period EMA.
The MACD is calculated by subtracting a 26-period exponential moving average (EMA) of the price from its 12-period EMA. The result is the MACD line. When they converge (i.e. move closer together), the value of the MACD line will be closer to zero. Similarly, when they diverge – moving further away – the MACD line increases or decreases, depending on the trend’s direction. As such, when there is significant momentum, the two EMAs diverge, prompting a large rise or fall in the MACD line.
Next, a 9-day EMA of the MACD line, known as the ‘signal line,’ is calculated. It provides a further gauge of momentum. For example, if a market has been rising sharply and the MACD crosses below the signal line, the current difference between the two EMAs is declining below its average. As a result, the market may be about to reverse.
There is also a histogram, which plots the difference between two lines on the chart. Simply put, when the histogram is positive, it indicates the trend is bullish. When it’s negative, the trend can be considered bearish.
MACD Inputs for Crypto
But what about the best MACD settings for crypto? Traders think that it's best to keep them at their defaults. Most traders use the default settings in their MACD crypto strategies, meaning that more people are trading the same signals and driving the market in the same direction.
How to Use the MACD for Crypto
Many use the MACD indicator for crypto trading because of the effective signals it generates. There are three primary setups: the signal line crossover, zero line crossover, and bullish and bearish divergence. If you’d like to follow along, head over to the free TickTrader platform and add the indicator to your chart.
1. Signal Line Crossover

The signal line crossover is one of the most common setups found in this tool. A bullish crossover sees the MACD line crossing above the signal line, usually indicating a bullish reversal. Conversely, a bearish crossover, where the MACD line falls below the signal line, suggests a possible bearish reversal. These crossovers effectively demonstrate that the current momentum is waning.
2. Zero-Line Crossover
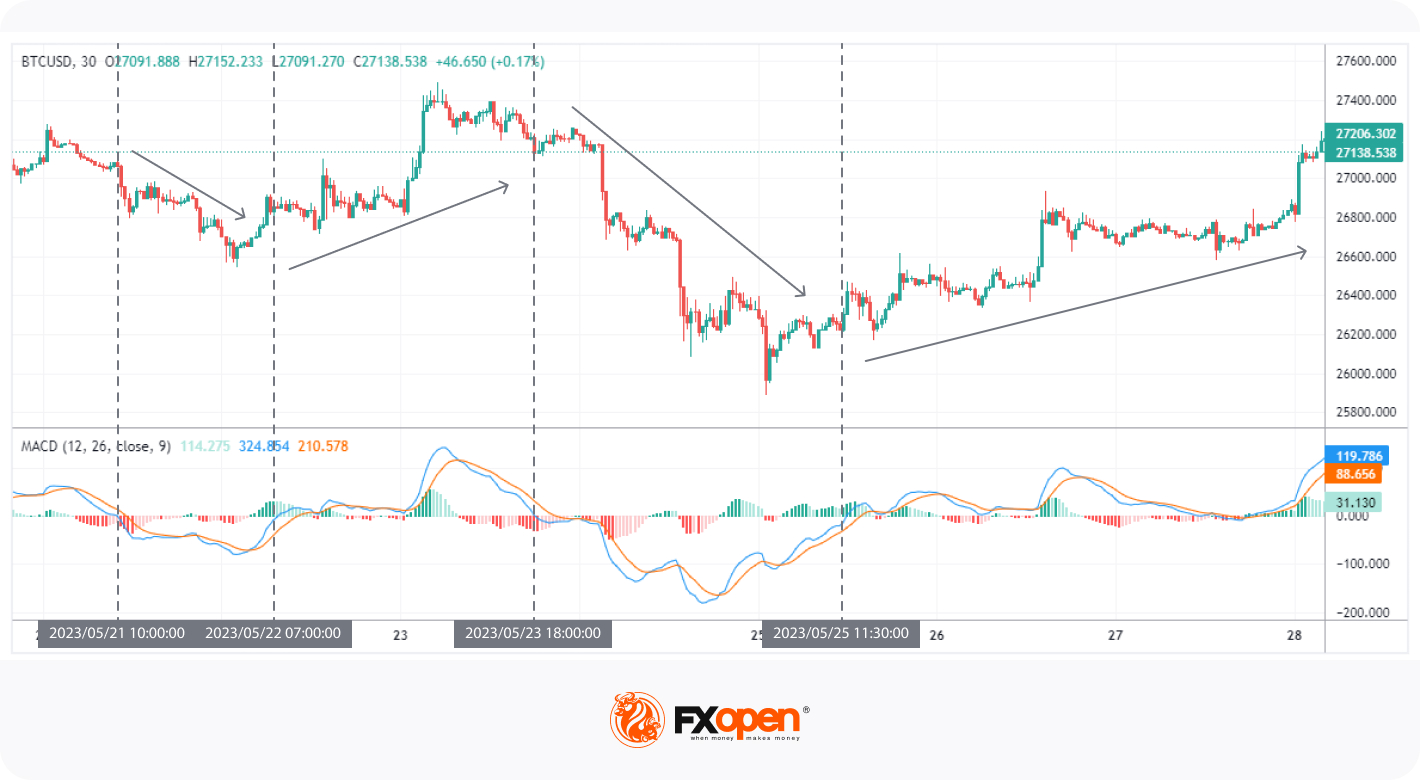
The zero-line crossover represents a change in the overall trend. When the MACD line crosses above zero, it shows that the short-term EMA is above the long-term EMA, hinting at bullishness. The opposite is true when it crosses below zero. It’s simply another way to show an EMA crossover, helping traders determine the general market direction.
3. Bullish and Bearish Divergence
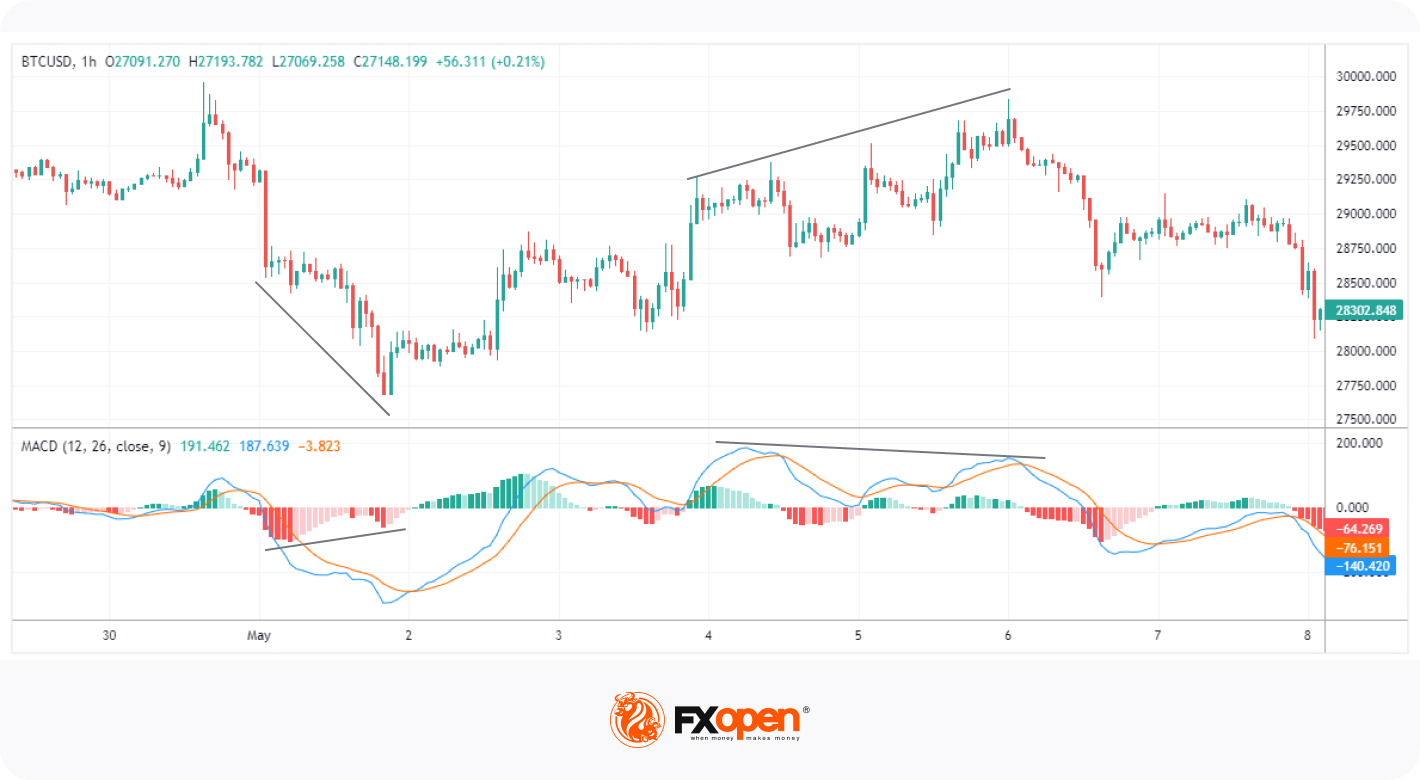
A rare but effective signal is the bullish and bearish divergence. A bullish divergence is seen when the price hits a new low, but the indicator forms a higher low. In contrast, a bearish divergence occurs when the price reaches a new high, but the tool makes a lower high, indicating a potential price drop. In both scenarios, it suggests that a reversal may be due.
Note that these divergences can occur in the highs and lows of the histogram and the MACD line itself. In both cases, they suggest that momentum isn’t as strong as it previously was. However, it’s usually easier to spot divergences in the lines.
Watch Out for False MACD Signals
You will sometimes see false signals from the MACD, meaning crypto traders should be aware of the indicator’s pitfalls before incorporating the indicator into a strategy.
They are most frequently produced in flat or ranging markets. Momentum is easy to determine when prices are volatile and trending; when the market is flat, the two EMAs making up the MACD line won’t see much separation. This can result in whipsawing action in the indicator, with the MACD and signal lines crossing over often. It’s normally best to wait for the market to begin trending again before considering a position.
It’ll also occasionally produce conflicting signals. For instance, you may see a bullish signal line crossover while a bearish divergence forms. In these scenarios, gaining further insight from other technical tools is a good idea. If the bearish divergence occurs at a significant resistance level, then you have extra confirmation that a reversal is likely. You can then hold fire until a bearish signal line crossover occurs to jump in on the reversal trade.
MACD vs RSI Indicator

The relative strength index (RSI) is another popular momentum indicator similar to the MACD. It helps traders identify overbought and oversold conditions when it moves above 70 or below 30, respectively. However, while the MACD measures momentum through two moving averages, the RSI measures the speed and change of price movements and is bounded between 0 and 100. In other words, they measure the same aspect, just in different ways.
Many crypto traders use both at the same time. For example, a trader may identify a divergence in the RSI and then wait for a signal line crossover in the MACD to make an entry. However, it could be argued that the MACD is a more versatile indicator, given its two lines and histogram vs the RSI’s single line.
The Bottom Line
The MACD is a popular technical analysis tool, and for a good reason. It's an upgrade from the regular moving average crossover strategies many use, offering multiple signals that offer insights into trend strength and impending reversals.
Of course, the tips given here don’t just apply to crypto – they can be used in whichever market you prefer, including forex, commodities, and stocks. If you’re ready to put your MACD skills to the test across 600+ markets, you can open an FXOpen account and benefit from lightning-fast execution speeds, low trading costs, and the advanced TickTrader platform. Good luck!
At FXOpen UK and FXOpen AU, Cryptocurrency CFDs are only available for trading by those clients categorised as Professional clients under FCA Rules and Professional clients under ASIC Rules, respectively. They are not available for trading by Retail clients.
This article represents the opinion of the Companies operating under the FXOpen brand only. It is not to be construed as an offer, solicitation, or recommendation with respect to products and services provided by the Companies operating under the FXOpen brand, nor is it to be considered financial advice.
Stay ahead of the market!
Subscribe now to our mailing list and receive the latest market news and insights delivered directly to your inbox.


Latest articles

AUD/USD and USD/CAD React to Softer US Inflation
Commodity-linked currencies strengthened after US inflation data came in weaker than expected. The Consumer Price Index (CPI) slowed to 3.5% year-on-year in June, below the 3.8% forecast, while core inflation eased to 2.6% versus expectations of 2.

NVIDIA: Kyber NVL144 Dispute Weighs on the Stock
NVIDIA shares found themselves at the centre of debate over the future of the Kyber NVL144 system. On 6 July, CNBC, citing research firm SemiAnalysis, reported that the project could be delayed by more than a year—from 2027 to

EUR/GBP: Trendline Support or Breakdown to New Lows?
EUR/GBP has slid to its weakest level in a year, as the two currencies continue to follow increasingly divergent paths. The ECB's June hike—its first since 2023—was meant to signal renewed hawkishness, but the very next inflation