


Litecoin Breaks Out, Bitcoin Volatile
FXOpen
Litecoin broke above last month’s high and almost hit the $50 round figure. Bitcoin, on the other hand, traded mostly range-bound during the past week.
Bitcoin Volatile but Range-bound
It’s been a volatile week for bitcoin. The key $2,400 level was broken and with that, the months-long uptrend is over. During the forking fears, a low of $2,250 was hit last Thursday. But since then we’ve bounced nicely and are currently quoted at $2,677, little changed compared to last week.
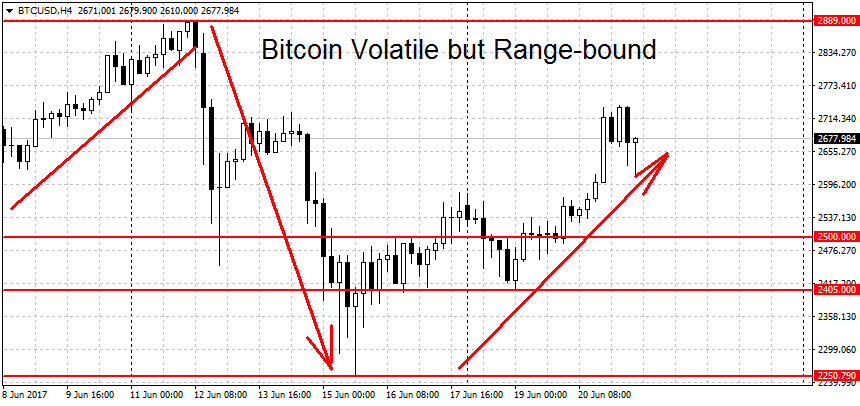
Today a high of $2,738 was seen on FXOpen before prices retraced a bit. The reason for the latest rally is progress on the scaling stalemate. On Monday over 80% of the mining hash started signalling for Segwit2x. This is a technical solution that merges the Segwit upgrade with a 2MB hard fork three months later. For more on the possible scenarios after the new developments take a look at this article.
Technically BTC/USD is now in a range. A new rally requires a breakout above the all-time highs at $2,889 on Fxopen (around $3,000 on other major exchanges). On the lower end, there’s some weak support at the $2,500 round figure, closely followed by the $2,405 swing low. A break below $2,250 is needed to start a new BTC downtrend. Further down we have more support at the $2,000 round figure and the $1,718 swing low. On the longer-term timeframes, both weekly and monthly, bitcoin remains in an uptrend.
Start Bitcoin fx trading with FXOpen.
Litecoin Nears $50 Dollars
Litecoin is at it again. Prices broke beyond the May highs on Saturday and kept going. By the end of the day a high of $45.88 was hit and two days later we peaked at $49.77 on FXOpen with other exchanges hitting the $50 mark.
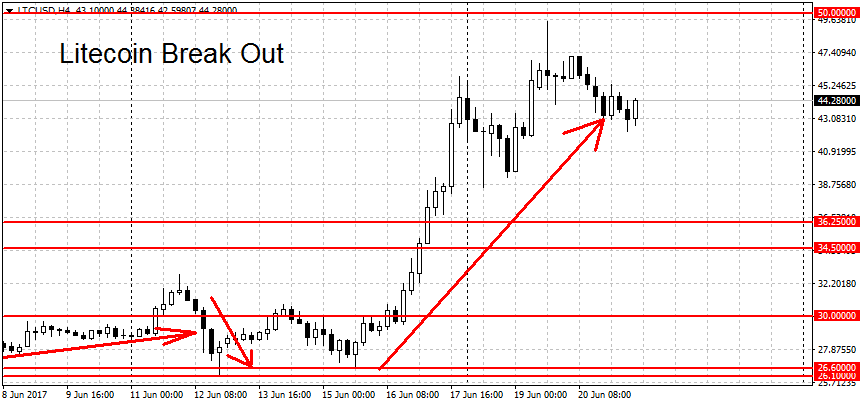
With the break above $34.50, we’re now in a new uptrend. Resistance above can be found at the $50 round figure. A clean breakout above this important milestone could extend the gains. On the way down we have support at the May highs of $36.25 (resistance becomes support). This is followed by two more previous peaks at $34.64 and $32.80.
Lower still we have the $30 round figure and the $26.62 and $26 swing lows as potential support levels. A clearing of this support area and a fall below $26 could end the current uptrend. Similarly to bitcoin, on the weekly and monthly charts LTC/USD looks bullish.
FXOpen offers the world's most popular cryptocurrency CFDs*, including Bitcoin and Ethereum. Floating spreads, 1:2 leverage — at your service (additional fees may apply). Open your trading account now or learn more about crypto CFD trading with FXOpen.
*Important: At FXOpen UK, Cryptocurrency trading via CFDs is only available to our Professional clients. They are not available for trading by Retail clients. To find out more information about how this may affect you, please get in touch with our team.
This article represents the opinion of the Companies operating under the FXOpen brand only. It is not to be construed as an offer, solicitation, or recommendation with respect to products and services provided by the Companies operating under the FXOpen brand, nor is it to be considered financial advice.
Stay ahead of the market!
Subscribe now to our mailing list and receive the latest market news and insights delivered directly to your inbox.


Latest articles

Pound at Key Levels: Markets Assess Impact of Political Uncertainty in the UK
The British pound remains under pressure following increased political uncertainty in the United Kingdom triggered by the Prime Minister’s resignation. Investors are assessing potential shifts in the political and economic policy outlook after the head of government stepped down,

Silver: Fed Tightens Its Tone as Price Returns to the Volume Profile Zone
Silver came under pressure following the Federal Reserve’s June meeting, at which policymakers kept interest rates unchanged at 3.50–3.75%. Nine of the 18 committee members still see the possibility of a rate increase this year, reinforcing

Ethereum: Market Assesses the Strength of the Corrective Recovery
Following a period of heightened volatility in early June, investor attention in Ethereum has once again shifted towards institutional demand and the development of the spot ETF market in the United States. The funds launched last year continue to serve