


Litecoin Prices Go Parabolic
FXOpen
Another good week for crypto-currencies. Bitcoin is continuing its climb higher, now in its fifth week with sizeable gains. Litecoin prices have gone parabolic, up from $99 last Tuesday to $301 dollars today.
Bitcoin Continues Bullish Trend
The bullish trend that started last month is still in play for bitcoin. Yesterday we hit a high of $17,547 dollars per coin, up from $11,712 last week. This is a gain of $5,835 dollars or just under 50 percent. We are currently quoted at $16,473 dollars. If prices close above $14,350 this Sunday, it would be the fifth green week in a row with large gains.
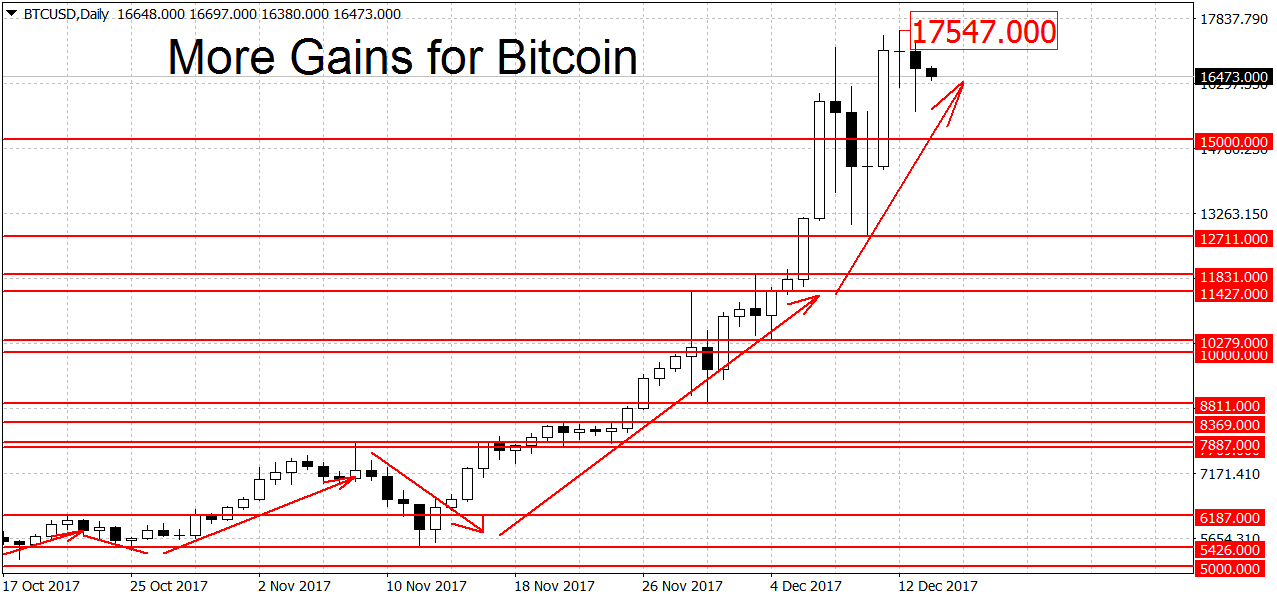
To end the current uptrend the bears will have to stage a decisive break of the $10,000 round figure. A new downtrend requires a move below the support area around $7,874 dollars per coin. Above the important $10,000 round figure support can be found at $10,279 swing low and the swings highs at $11,427 and $11,831 dollars. These are followed by more support at the $12,711 swing low and the $15,000 round figure.
Considering that we’re trading only few percent below all-time highs, there’s not much in terms of resistance above current prices. The all-time high at $17,547 is a notable level as are the $18,000 and $19,000 round figures but these may not provide much resistance. A stronger level can be found at the $20,000 round figure where some market participants may take profit. On the long-term weekly and monthly charts BTC/USD is still looking bullish.
The news cycle has benefited bitcoin. The first futures on traditional markets launched on Sunday at the CBOE. You can follow a delayed price feed for the January contract. Currently, they are trading at $16,870 dollars, a relatively small premium to spot prices. Premiums swung widely since launch, however, nearing $1,500-$2,000 dollars at times.
Litecoin Prices Skyrocket
Litecoin prices have gone parabolic, rallying from $99 dollars to a high of $347.50 in less then six days. The altcoin is currently quoted at $301 dollars.
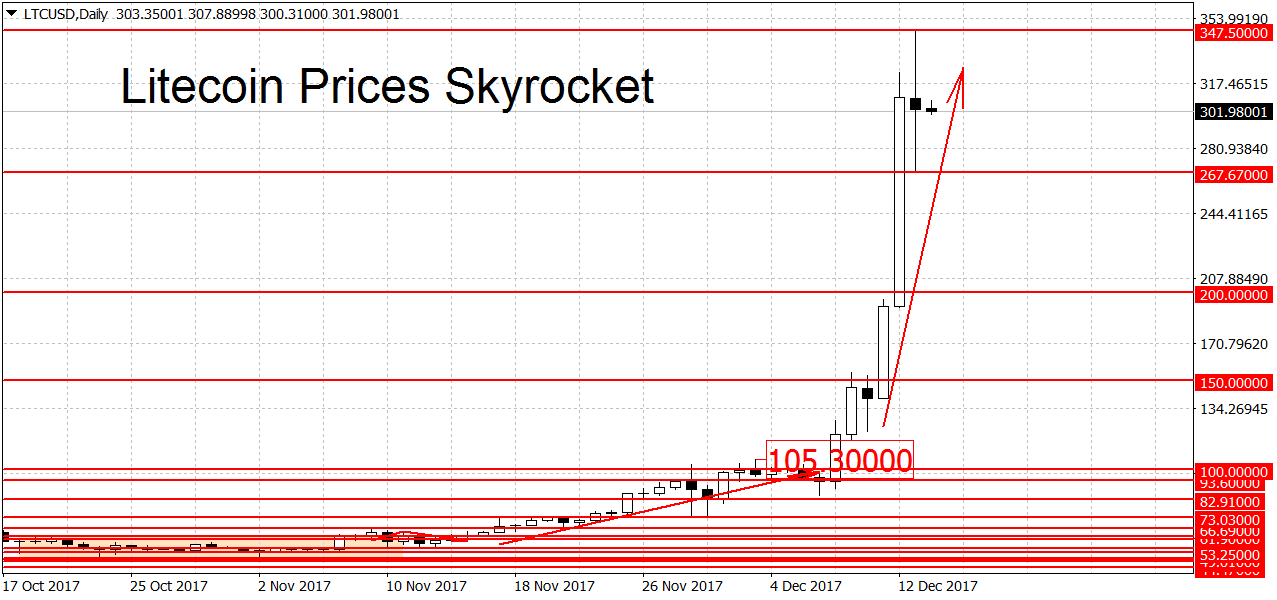
The near one-month-long uptrend continues. To end it the bears have to push LTC/USD back below the $100 round figure. A new downtrend may commence on a break of the $73 dollars swing low. Some (likely weak) support can be found at the $150, $200 and $300 round figures. We have somewhat stronger support at the $267.67 swing low. The all-time high at $347.50 may act as resistance, backed up by the $350 round figure. Similarly to BTC/USD, litecoin is also bullish on the long-term weekly and monthly charts.
Try Bitcoin MT4 trading with FXOpen broker
FXOpen offers the world's most popular cryptocurrency CFDs*, including Bitcoin and Ethereum. Floating spreads, 1:2 leverage — at your service (additional fees may apply). Open your trading account now or learn more about crypto CFD trading with FXOpen.
*Important: At FXOpen UK, Cryptocurrency trading via CFDs is only available to our Professional clients. They are not available for trading by Retail clients. To find out more information about how this may affect you, please get in touch with our team.
This article represents the opinion of the Companies operating under the FXOpen brand only. It is not to be construed as an offer, solicitation, or recommendation with respect to products and services provided by the Companies operating under the FXOpen brand, nor is it to be considered financial advice.
Stay ahead of the market!
Subscribe now to our mailing list and receive the latest market news and insights delivered directly to your inbox.


Latest articles

Apple: Earnings Day Above the Activity Zone
On 30 April, after the market close, Apple Inc. will release its financial results for the second quarter of fiscal 2026. The consensus forecast, based on estimates from 31 analysts, points to revenue of around $109.7 billion, with expected

USD/JPY and USD/CHF Near Key Levels: The Dollar Supported by the Fed
The US dollar continues to trend upwards following the Federal Reserve meeting, drawing support from the regulator’s moderately hawkish stance and comments by Jerome Powell. Markets interpret the Fed’s rhetoric as a signal that restrictive policy is likely

EUR/USD and GBP/USD consolidate ahead of the Fed decision
European currencies are showing subdued dynamics, entering a consolidation phase following their previous advance. Earlier, EUR/USD and GBP/USD broke out of their ranges and strengthened; however, the subsequent correction has led both pairs to retest the previously breached