


Litecoin Still Range-bound as Bitcoin Retests Highs
FXOpen
Alternative cryptocurrency Litecoin is still trading range-bound. The altcoin is trading basically unchanged since our LTC update last week, still quoted at $3.02 dollars per coin. Meanwhile bitcoin continued to roar ahead, breaking new highs.
Bitcoin Hits $288.90 on FxOpen
In the past seven days bitcoin managed to break the $270 resistance figure and head higher. Prices hit a new high of $288.90 two days ago, very close to the $290 weak resistance. This caused another sharp retracement down to $274 dollars per coin but the lows didn’t last long. Bitcoin is currently quoted at $285.24, very close to the Sunday highs.
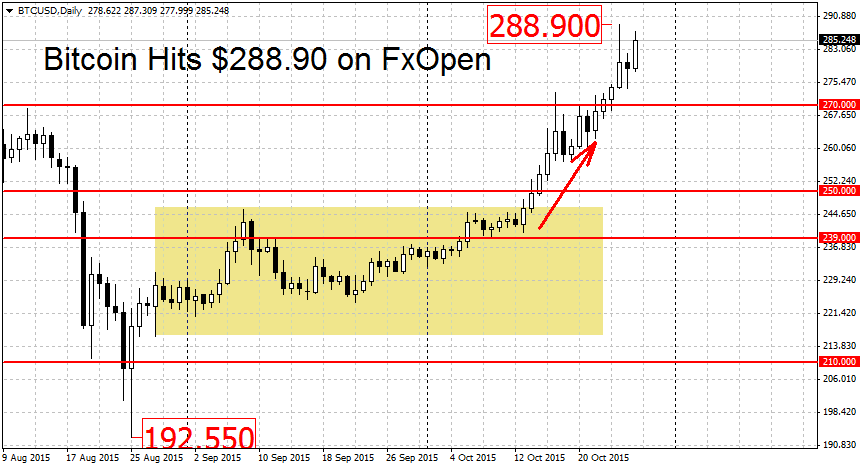
The rally is still in full force. A break above the $290 dollars resistance may lead to some gains but soon after we find the $300 round figure, a major resistance level. Because bitcoin prices differ, it’s probably a good idea to watch other bitcoin exchanges as well. Fxopen usually trades at a small $2-$3 premium to other USD exchanges. When prices peaked at $288.90, other USD exchanges hit highs near $298/$299 dollars per coin. We may get a reaction on Fxopen once these exchanges trade around $300 dollars
A decisive breakout above the $300 round figure may intensify the gains. Higher up we find another resistance at the $310 July high, followed by this year’s high for BTC at $318 dollars per coin.
On the downside, some support can be found at the $270 resistance level. A break below the $256 swing low may end the current rally but right after we find a strong support at $250 dollars. A major level for bitcoin, $250 was the starting point for the previous June/July rally, the subsequent August decline and the latest October breakout. With prices now trading above this level, it’s likely that it will act as support once again.
Litecoin Still Stuck in a Range
Litecoin is still stuck in a range. In the past week LTC/USD traded between a high of $3.08 and a low of $2.9610 but ultimately we settled at $3.0273, only $0.0003 above the $3.0270 price noted in our update. The range is increasingly getting narrower, as we can see on the chart below.
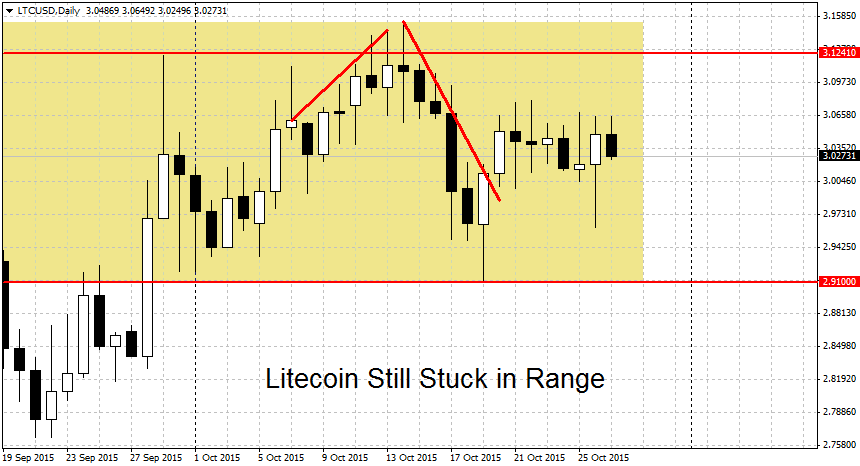
The figure to beat on the upside stands at $3.19 dollars per coin, right above the key resistance. Here we have a former swing high at $3.1799 and a previous swing low at $3.1840. A clean breakout higher may jump-start a new LTC rally.
On the downside a decisive breakdown below the $2.91 swing low may lead to a downtrend in prices. Below here some support can be found at $2.70, followed by the four-month low for Litecoin at $2.50 dollars. Lower still, the January swing high at $2.40 may act as support, followed by a strong support area near $2-$2.05 dollars per coin.
FXOpen offers the world's most popular cryptocurrency CFDs*, including Bitcoin and Ethereum. Floating spreads, 1:2 leverage — at your service (additional fees may apply). Open your trading account now or learn more about crypto CFD trading with FXOpen.
*Important: At FXOpen UK, Cryptocurrency trading via CFDs is only available to our Professional clients. They are not available for trading by Retail clients. To find out more information about how this may affect you, please get in touch with our team.
This article represents the opinion of the Companies operating under the FXOpen brand only. It is not to be construed as an offer, solicitation, or recommendation with respect to products and services provided by the Companies operating under the FXOpen brand, nor is it to be considered financial advice.
Stay ahead of the market!
Subscribe now to our mailing list and receive the latest market news and insights delivered directly to your inbox.


Latest articles

Apple: Earnings Day Above the Activity Zone
On 30 April, after the market close, Apple Inc. will release its financial results for the second quarter of fiscal 2026. The consensus forecast, based on estimates from 31 analysts, points to revenue of around $109.7 billion, with expected

USD/JPY and USD/CHF Near Key Levels: The Dollar Supported by the Fed
The US dollar continues to trend upwards following the Federal Reserve meeting, drawing support from the regulator’s moderately hawkish stance and comments by Jerome Powell. Markets interpret the Fed’s rhetoric as a signal that restrictive policy is likely

EUR/USD and GBP/USD consolidate ahead of the Fed decision
European currencies are showing subdued dynamics, entering a consolidation phase following their previous advance. Earlier, EUR/USD and GBP/USD broke out of their ranges and strengthened; however, the subsequent correction has led both pairs to retest the previously breached