


Litecoin Surges 30 Percent, Bitcoin Still Range-bound
FXOpen
Big brother bitcoin continues to trade in a range. After several days with tentative gains, BTC/USD fell by $5 dollars yesterday. Litecoin on the other hand, surged 30 percent on Friday so let’s start with that.
Litecoin Surges 30 Percent
Litecoin surged 45 cents on Friday, or about 30 percent The crypto staged most of the gains in only 3 hours, after breaking the previous swing high at $1.60. Prices rallied by 2.4%, 4.9% and 13.52% in each of the three hours, hitting a high at $1.93 dollars. We have since eased up somewhat with LTC trading at $1.80 dollars per coin. Here’s a daily Litecoin chart. The massive move on May 22nd is clearly visible.
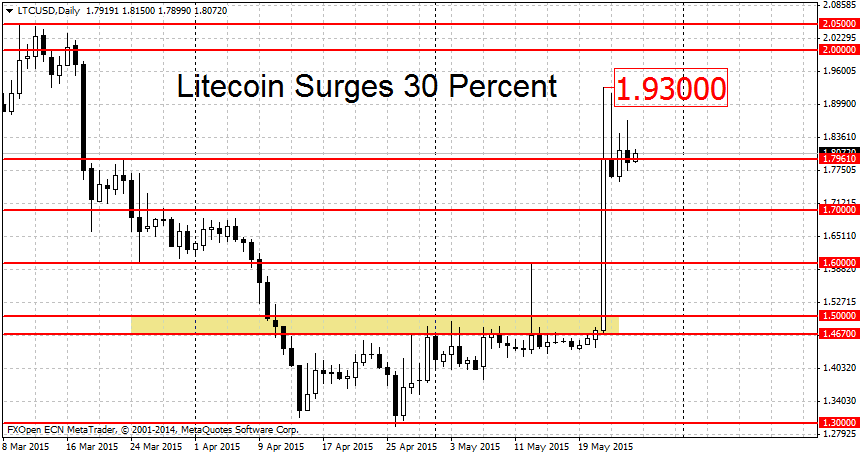
With LTC now firmly in an uptrend, let’s take a look at some levels. On the lower end, weak support can be found around the March 23rd swing high at $1.7961, so $1.80 basically. Prices have been trading back and forth, above and below this level, for the past four days now. Below here, more weak support levels can be found at $1.70 and $1.60. The former resistance at the $1.50 round figure should now act as support to falling prices. The bears will need to push LTC/USD below this mark to end the current uptrend.
On the higher end, we have three potential resistance levels bunched up around the $2 dollars mark. First there is Friday’s high at $1.93. This is followed by $2 dollars itself and ends with $2.05, a former swing high and resistance level. The LTC gains should accelerate if the bulls manage to clear this resistance area and push above $2.05 dollars per coin.
Bitcoin Still Range-bound
Unlike it’s little brother, bitcoin is still in the doldrums. The brief upward momentum disappeared with yesterday’s losses. To spark a new rally, prices need to clear the important $250 dollars mark. If this occurs, the first, albeit weak resistance level, can be found at $258 (April 6th swing high). This is followed by a somewhat stronger resistance at $270. Higher up, the triple top at $300 dollars per coin will be crucial. A breakout above it should accelerate the gains. You can see all of these levels marked on the chart below.
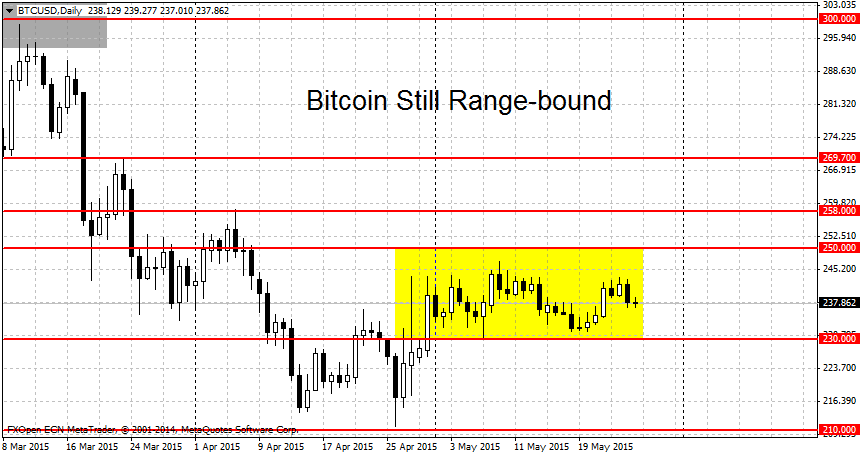
On the lower end, the first weak support is at $230. This is followed by the double bottom near $210 dollars per coin. As we’ve mentioned previously, the area from $200 to $210 should be viewed as one support area. The bears will need to push prices below $200 dollars per coin to spark a new downtrend.
FXOpen offers the world's most popular cryptocurrency CFDs*, including Bitcoin and Ethereum. Floating spreads, 1:2 leverage — at your service (additional fees may apply). Open your trading account now or learn more about crypto CFD trading with FXOpen.
*Important: At FXOpen UK, Cryptocurrency trading via CFDs is only available to our Professional clients. They are not available for trading by Retail clients. To find out more information about how this may affect you, please get in touch with our team.
This article represents the opinion of the Companies operating under the FXOpen brand only. It is not to be construed as an offer, solicitation, or recommendation with respect to products and services provided by the Companies operating under the FXOpen brand, nor is it to be considered financial advice.
Stay ahead of the market!
Subscribe now to our mailing list and receive the latest market news and insights delivered directly to your inbox.


Latest articles

Weekly Market Insights with Gary Thomson: The Week of Central Banks and Earnings
In this video, we’ll explore the key economic events and market trends, shaping the financial landscape. Get ready for insights into financial markets to help you navigate the week ahead. Let’s dive in!
In this episode of Market

Intel at a Crossroads: Earnings Beat Meets Technical Resistance
Intel has just delivered its strongest quarter in over fifteen years, and the market reaction says it all. Q2 2026 revenue surged 25% year-over-year to $16.1 billion, crushing the consensus estimate of $14.42 billion, while adjusted EPS of

Tesla: Complex Range Structure Breaks Down Following Quarterly Earnings
Tesla released its Q2 2026 results after the market closed on 22 July. Revenue increased 26% year-on-year to $28.24 billion, while vehicle deliveries reached a record 480,126 units. However, operating margin fell sharply to 1.4%, down from