


LTC and EOS - Ascending channels were corrective
FXOpen

LTC/USD
From last Wednesday when the price of Litecoin reached $59.991 at its highest point measured to today’s low at $51.864 we have seen a decrease of 13.55%. As you can see from the hourly chart below the price came up last week to the ascending channels resistance level and got rejected like expected which is why we have seen the move to the downside below it’s support level.
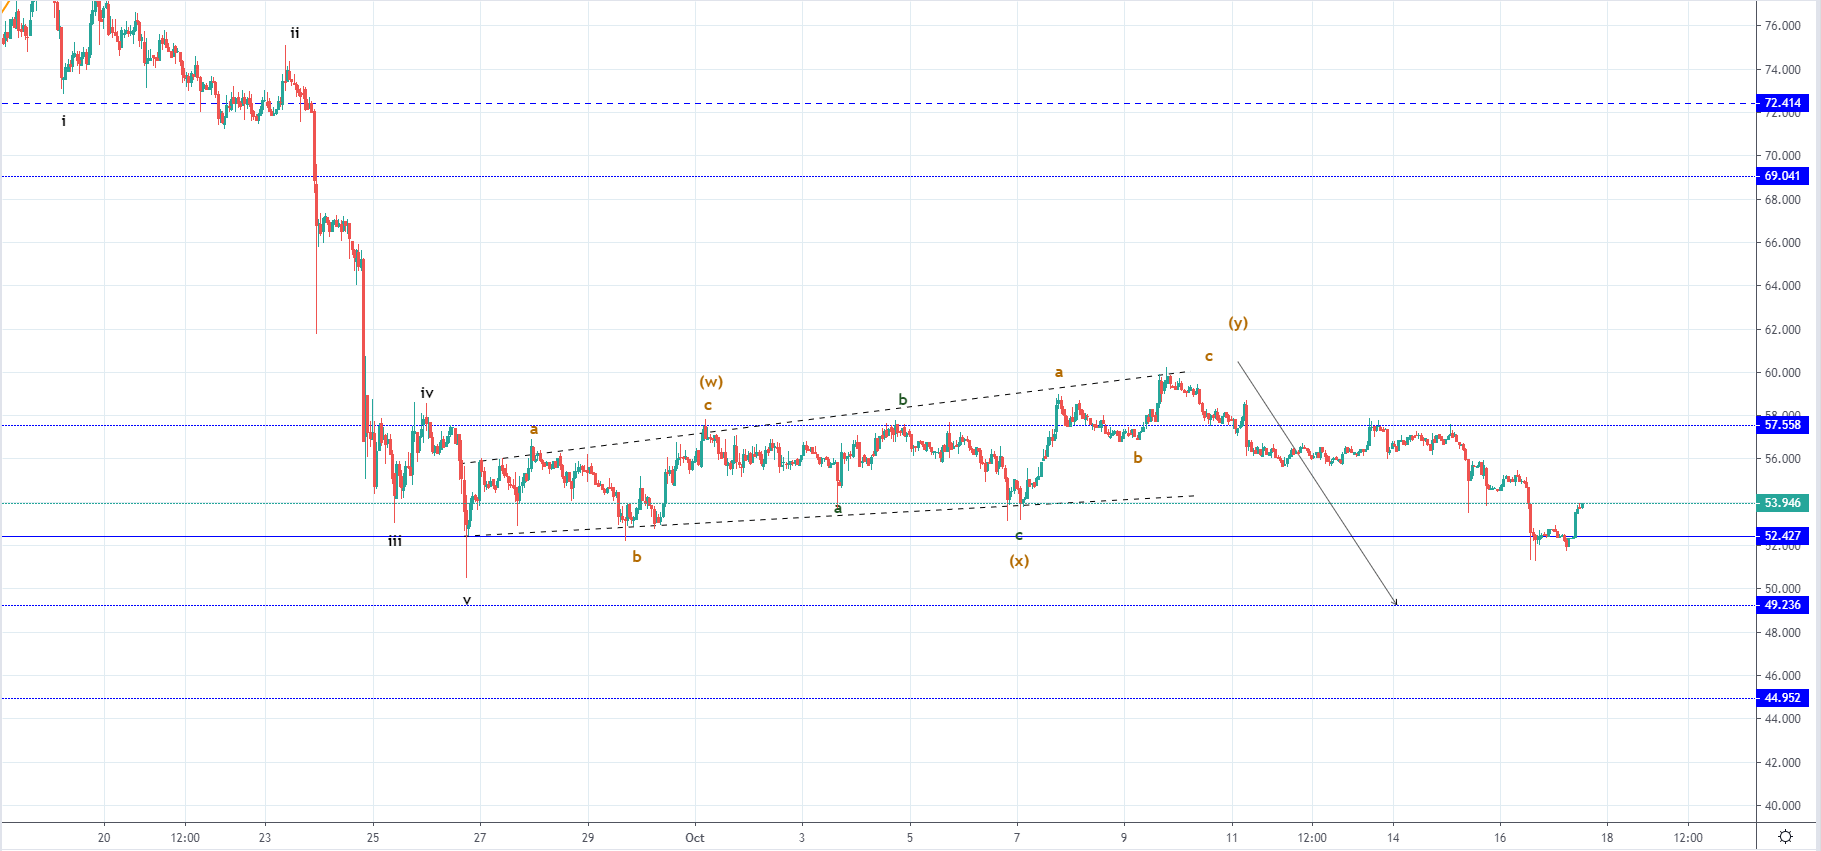 Prior to the completion of the WXY correction, we have seen a five-wave decrease to the downside which is why this corrective structure started developing. As it ended without prolongation the next move to the downside we are currently seeing could be the start of another five-wave move which is set to push the price to some of the horizontal support levels below $50, but at the moment we are seeing that the price found support on the $52.427 level which now serves as a pivot point.
Interaction with the horizontal support level today has caused a bounce with the price getting into an upward trajectory again and is showing signs of bullishness but is currently retesting the X wave low vicinity for resistance which could also serve as an indication of the future price action pathway. If the price continues moving above the current level, retest the $52.4 level and finds support there yet again it could mean that we have seen the completion of the descending move. But more likely the downfall is yet to develop fully in which case I would be expecting the price below $50.
EOS/USD
The price of EOS has been in a downtrend from last Wednesday like Litecoin and has decreased by 13.81% coming from Wednesday’s high at $3.319 to $2.86 at its lowest point today.
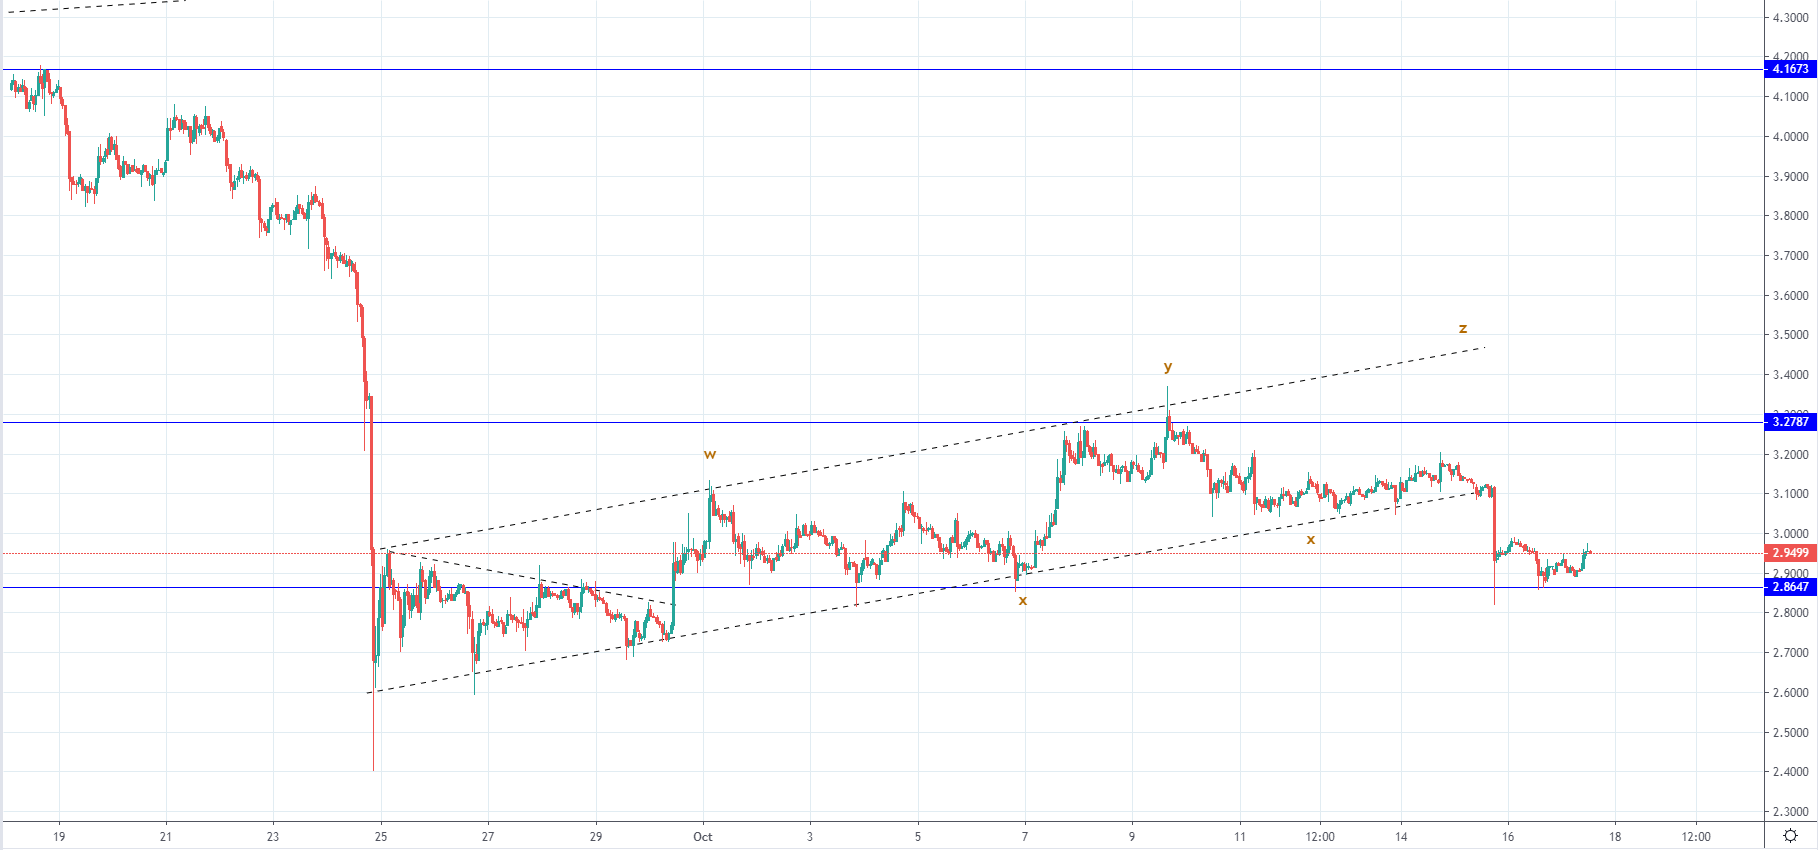 Looking at the hourly chart, you can see that the price of EOS also ended its WXY correction with no prolongation before starting to move to the downside again and breaking out from the ascending channels support level. The price found support on the next significant level which is the horizontal support at $2.86 as today’s interaction ended as a bounce. Currently, we are seeing the price struggling to make a higher high and is showing signs of weakness, indicated by the wick from the upper side of the previous hourly candle, signaling seller’s pressure is present at those levels so the bounce might not lead to a more sustainable one.
Similarly like in the case of Litecoin I would be expecting downtrend continuation from here below the horizontal support level and potentially as a retest of the $2.6 low which if doesn’t serve as another support point will result in a further downfall to $2.11 which is the next significant horizontal level in line.
FXOpen offers the world's most popular cryptocurrency CFDs*, including Bitcoin and Ethereum. Floating spreads, 1:2 leverage — at your service (additional fees may apply). Open your trading account now or learn more about crypto CFD trading with FXOpen.
*Important: At FXOpen UK, Cryptocurrency trading via CFDs is only available to our Professional clients. They are not available for trading by Retail clients. To find out more information about how this may affect you, please get in touch with our team.
This article represents the opinion of the Companies operating under the FXOpen brand only. It is not to be construed as an offer, solicitation, or recommendation with respect to products and services provided by the Companies operating under the FXOpen brand, nor is it to be considered financial advice.
Stay ahead of the market!
Subscribe now to our mailing list and receive the latest market news and insights delivered directly to your inbox.


Latest articles

Apple: Earnings Day Above the Activity Zone
On 30 April, after the market close, Apple Inc. will release its financial results for the second quarter of fiscal 2026. The consensus forecast, based on estimates from 31 analysts, points to revenue of around $109.7 billion, with expected

USD/JPY and USD/CHF Near Key Levels: The Dollar Supported by the Fed
The US dollar continues to trend upwards following the Federal Reserve meeting, drawing support from the regulator’s moderately hawkish stance and comments by Jerome Powell. Markets interpret the Fed’s rhetoric as a signal that restrictive policy is likely

EUR/USD and GBP/USD consolidate ahead of the Fed decision
European currencies are showing subdued dynamics, entering a consolidation phase following their previous advance. Earlier, EUR/USD and GBP/USD broke out of their ranges and strengthened; however, the subsequent correction has led both pairs to retest the previously breached