


LTC and EOS - Ascending trend lines broken, downside expected
FXOpen

LTC/USD
From last week’s low at $41.72 made on Friday the price of Litecoin has increased by 11.71% measured to the highest point on Monday which was at $46.61. Since then we have seen a decrease of 7.78% as the price fell to $43 area yesterday but made a minor recovery and is currently being traded around $43.6.
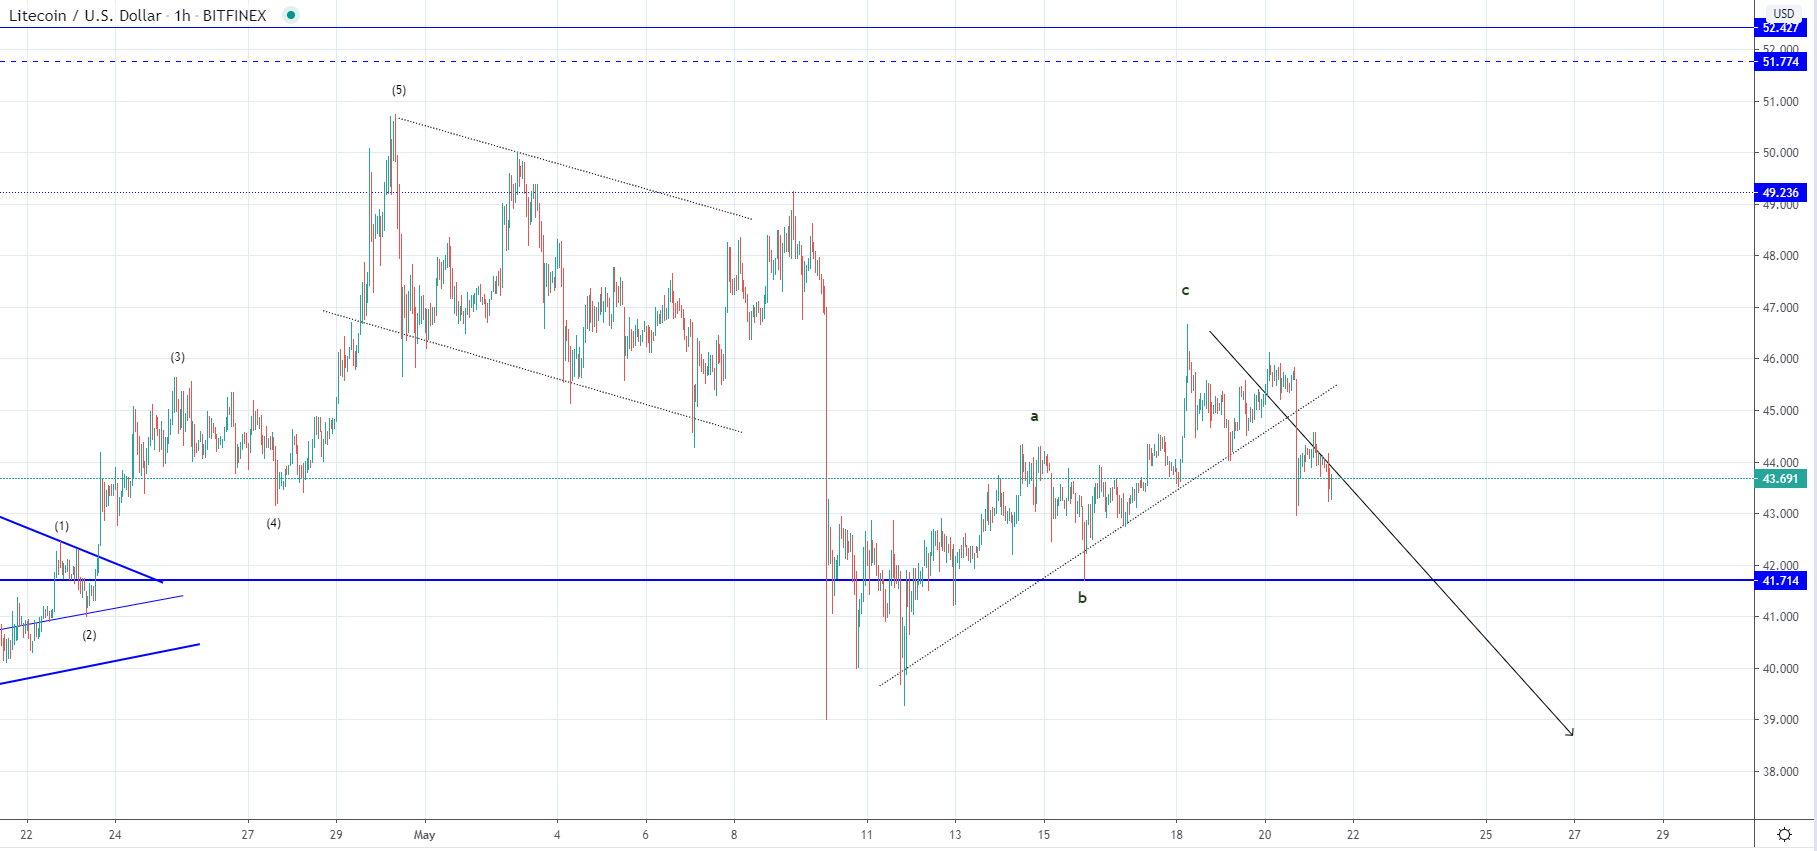 On the hourly chart, you can see that the price broke down the ascending trendline which formed since the 11th of May when the price was sitting at its lowest after a steep downfall. This trendline indicated that the recovery seen is out of the same degree and was most likely an ABC to the upside. The breakout could be an early indication that the correctional upside movement has ended with the price now starting another move to the downside.
C wave has a clear five-wave structure but the 3rd wave is the shortest which it cannot be. Another move to the upside could have looked likely because of this but as the price moved inside the territory of the 1st sub-wave from the C wave at $43.9 this possibility is invalidated. If the price continues moving to the downside and goes below yesterday’s low it could mean that the first five-wave move has developed to the downside in which case I would be expecting a correction to the half range at around $44.7 before the next downturn develops.
EOS/USD
From Monday’s high at $2.75 the price of EOS has decreased by little below 8% as it came down to $2.53 yesterday. After a slight recovery to $2.6 it’s currently being traded lower at around $2.56 and is in a downward trajectory.
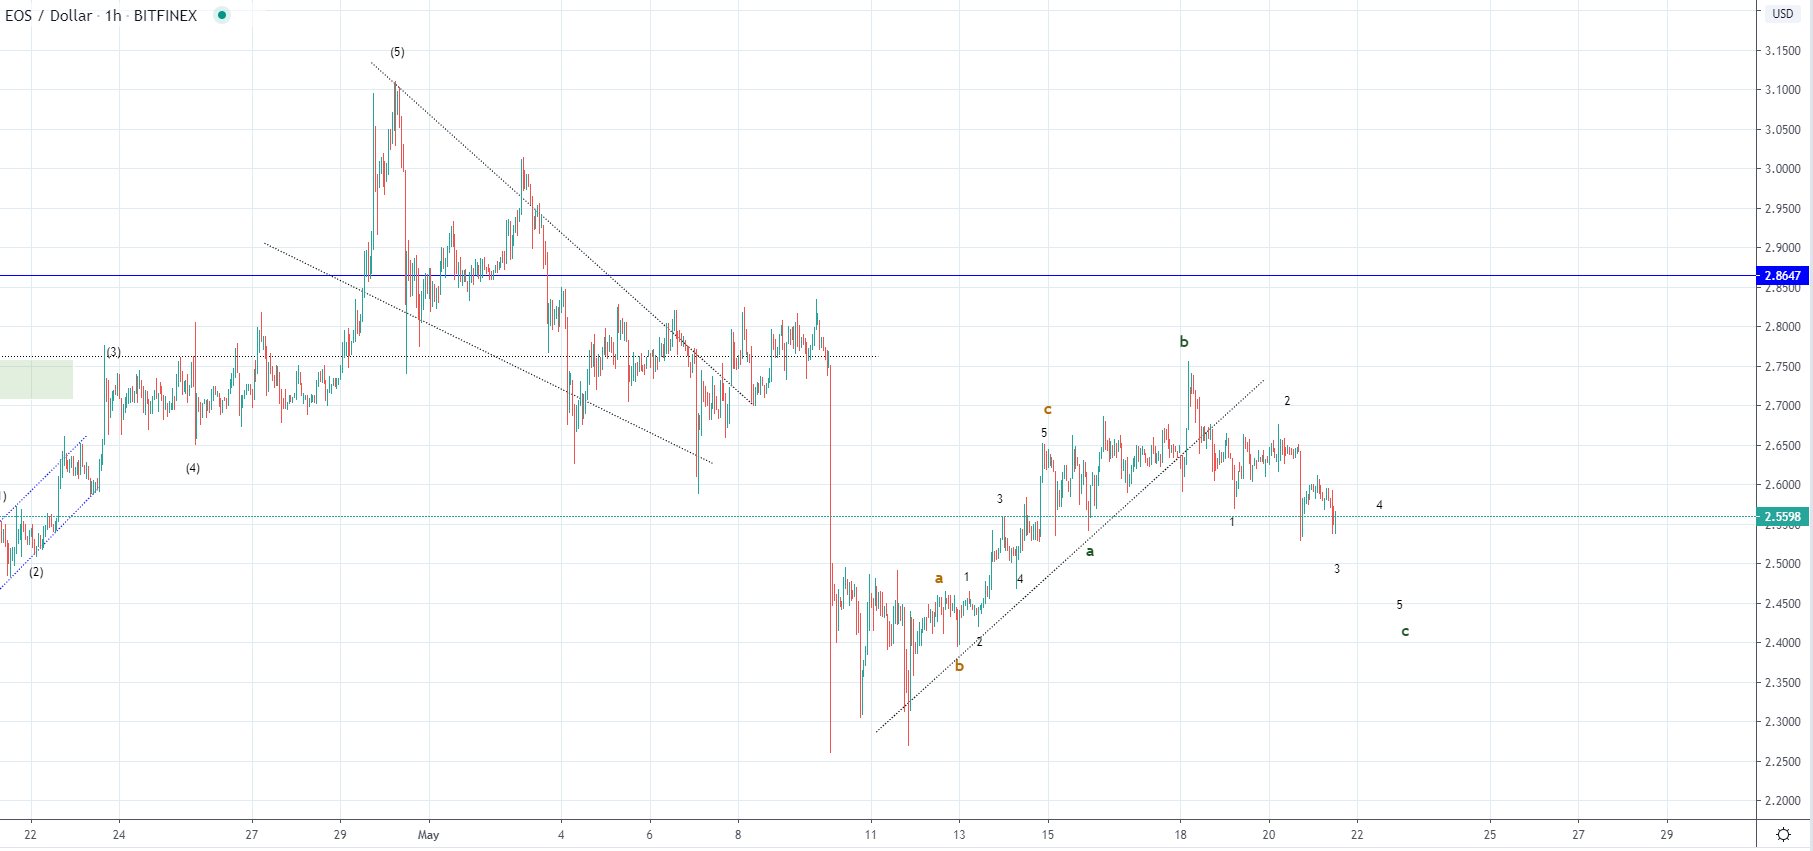
Looking at the hourly chart, we can see a similar pattern to that of LTC but a different interpretation can be made. A wave in the Litecoin’s chart is the ABC in this one with the next move that came after to the upside being the B wave out of the descend ABC to the downside which is now developing its C wave. If this is true then the price is likely to continue moving further to the downside after this minor lower low is being made and is likely to end around the vicinity of the A wave’s ending point at $2.45
But if this is true, then uptrend continuation could occur after the completion of the descending ABC as a further correctional movement to the upside could be anticipated.
FXOpen offers the world's most popular cryptocurrency CFDs*, including Bitcoin and Ethereum. Floating spreads, 1:2 leverage — at your service (additional fees may apply). Open your trading account now or learn more about crypto CFD trading with FXOpen.
*Important: At FXOpen UK, Cryptocurrency trading via CFDs is only available to our Professional clients. They are not available for trading by Retail clients. To find out more information about how this may affect you, please get in touch with our team.
This article represents the opinion of the Companies operating under the FXOpen brand only. It is not to be construed as an offer, solicitation, or recommendation with respect to products and services provided by the Companies operating under the FXOpen brand, nor is it to be considered financial advice.
Stay ahead of the market!
Subscribe now to our mailing list and receive the latest market news and insights delivered directly to your inbox.


Latest articles

Apple: Earnings Day Above the Activity Zone
On 30 April, after the market close, Apple Inc. will release its financial results for the second quarter of fiscal 2026. The consensus forecast, based on estimates from 31 analysts, points to revenue of around $109.7 billion, with expected

USD/JPY and USD/CHF Near Key Levels: The Dollar Supported by the Fed
The US dollar continues to trend upwards following the Federal Reserve meeting, drawing support from the regulator’s moderately hawkish stance and comments by Jerome Powell. Markets interpret the Fed’s rhetoric as a signal that restrictive policy is likely

EUR/USD and GBP/USD consolidate ahead of the Fed decision
European currencies are showing subdued dynamics, entering a consolidation phase following their previous advance. Earlier, EUR/USD and GBP/USD broke out of their ranges and strengthened; however, the subsequent correction has led both pairs to retest the previously breached