


LTC and EOS — Breakout Soon Expected!
FXOpen

LTC/USD
The price of Litecoin has been increasing from the 27th of June when it dipped below the $40 mark and spiked to the downside but managed to maintain above it after and was set into an upward trajectory, reaching $42 level at its highest point made on three occasions. Currently, it is being traded at around $41.448 and is in a downward trajectory from yesterday high overall.
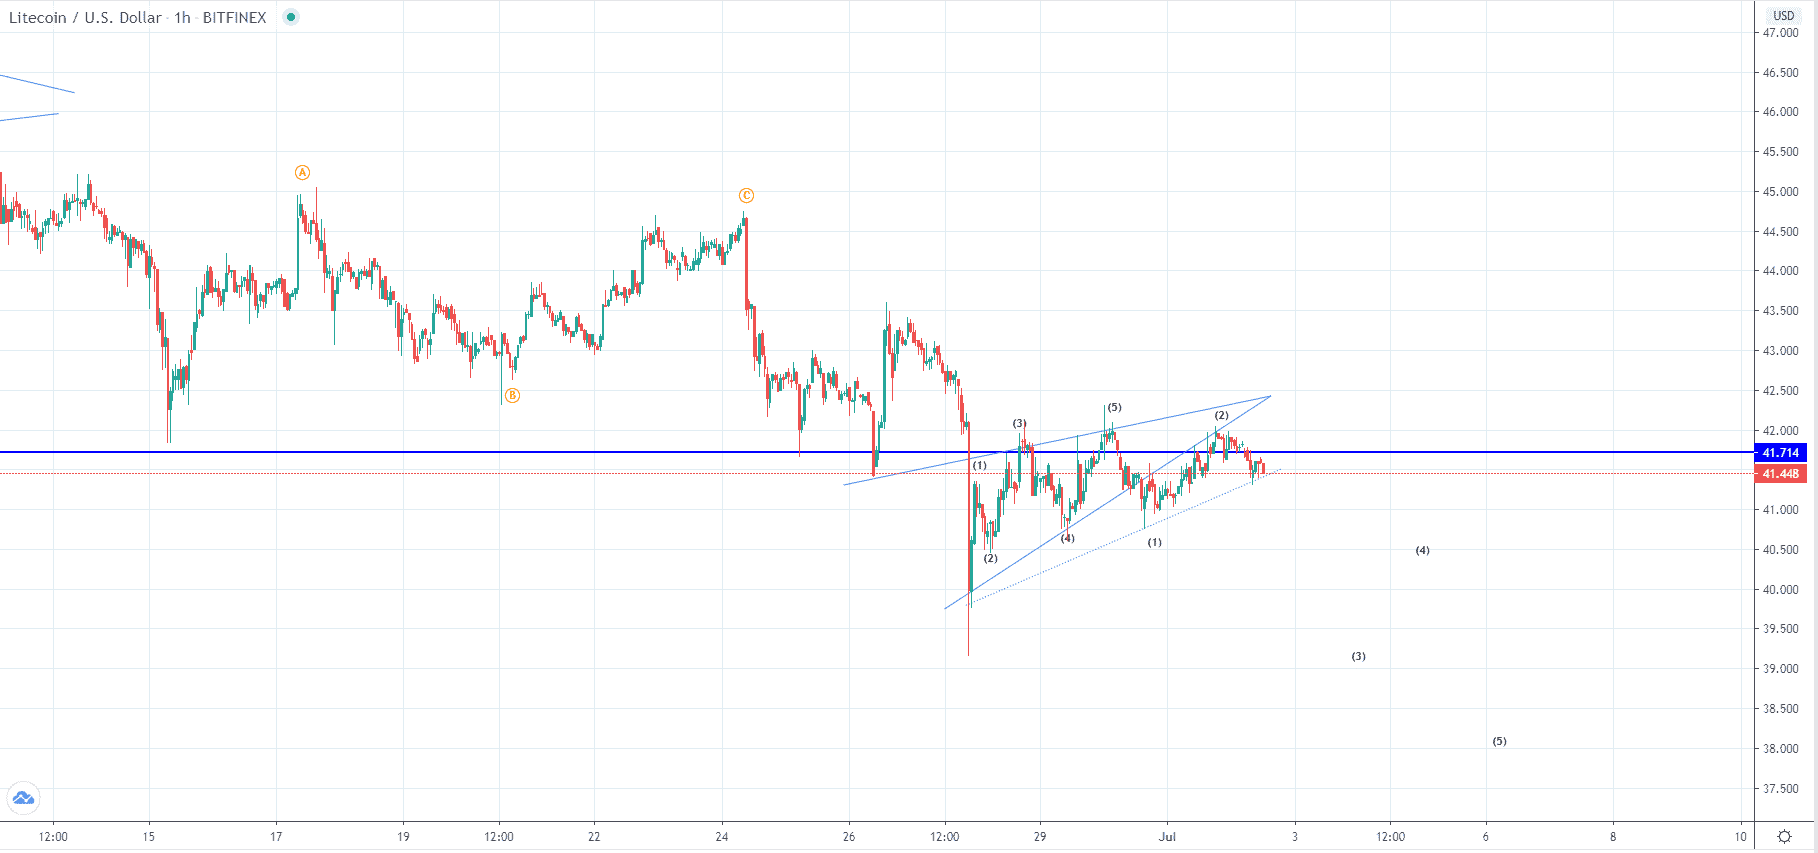 Looking at the hourly chart, you can see that an ascending triangle was been formed from the 27th of Jun’s low with the price not being able to go back up above the $42 levels of multiple occasions which is why today we have seen a breakout to the downside below the horizontal level again after a breakout below the ascending support level of the mentioned triangle. This is why further downside movement would be expected as we have most likely seen the completion of another corrective wave which could have been the C wave of a lower degree considering that it’s subdivided into a five-wave structure.
If this is true then the next move that already started is another five-wave impulse to the downside out of the same degree count but would be the 3rd wave out of the even higher degree count and would mean that the price is headed for even more downside after. Another possibility could be that we are seeing a leading diagonal as the corrective wave ended on the 27th in which case the descending move which is expected would end as a three-wave one not going below the Jun’s low.
EOS/USD
The price of EOS has made a decrease of 1.4% measured from yesterday’s high at $2.4 to the levels on which it is currently being traded which at $2.369.
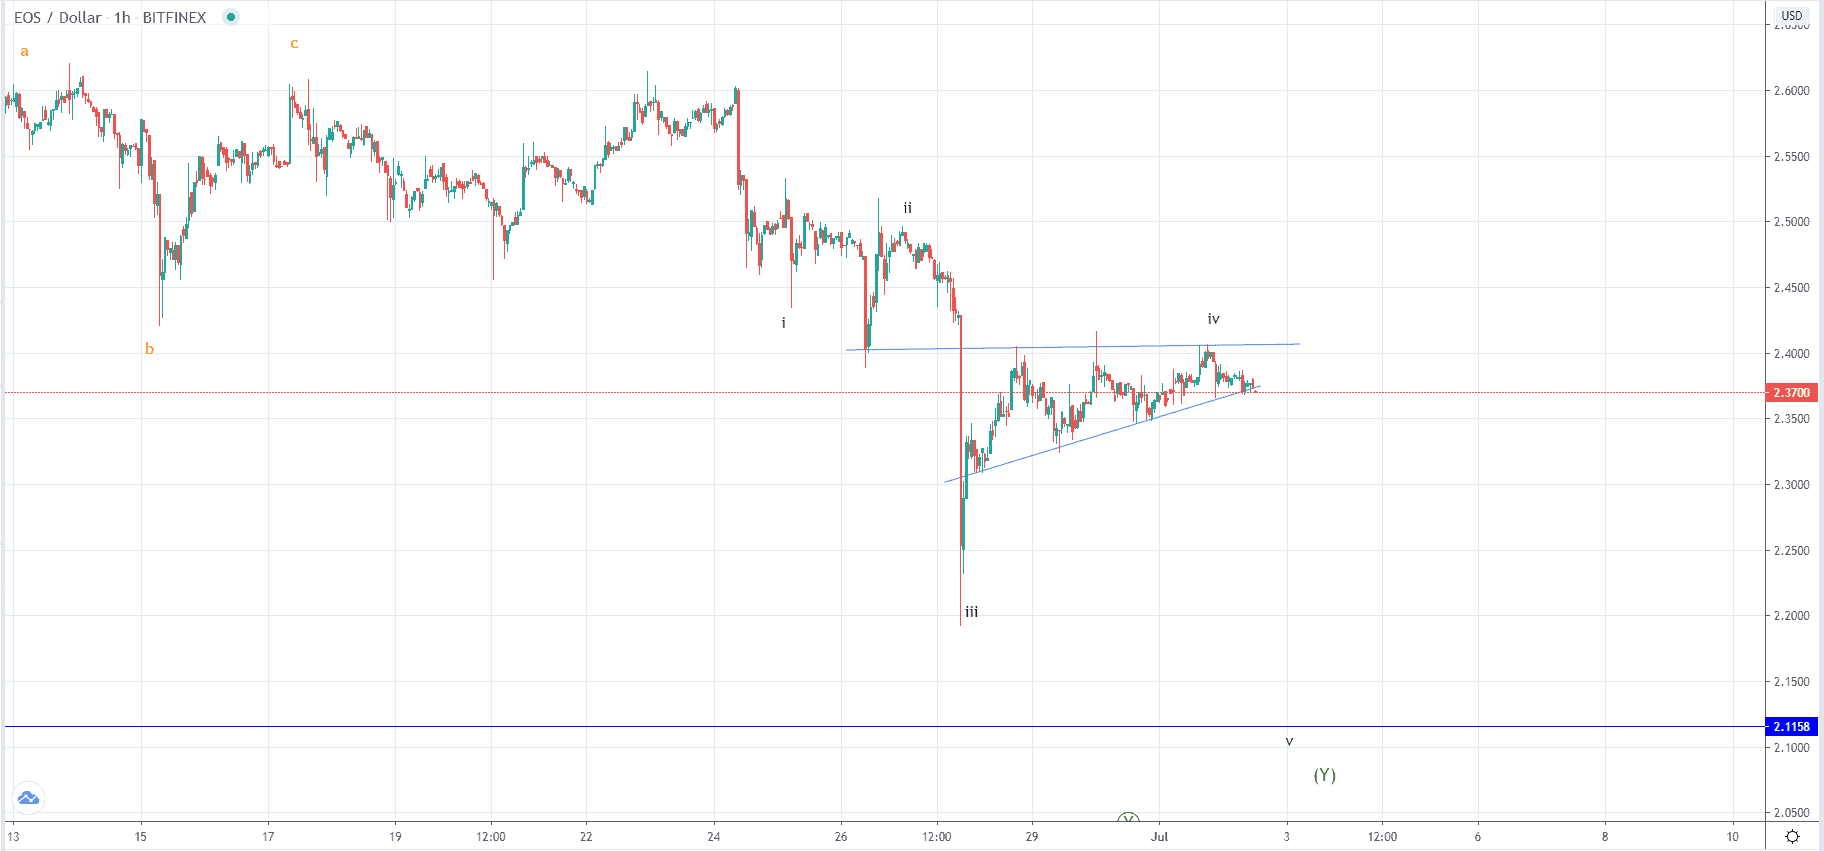
Like in the case of Litecoin we have seen an ascending triangle forming with the price not being able to surpass its horizontal resistance level at around yesterday’s high vicinity on three occasions. Two logics could be in play here, first being that because of this the buyer’s pressure is to break the horizontal level which got weakened in the process and second that the last rejection is to set the price into a downward trajectory as it failed to continue it breakout attempt.
The wave structure implies the completion of the three-wave structure so we could have seen the development of an ABC to the downside but we could have also seen the development of the 3rd wave from a five-wave impulse in which case the seen ascending triangle would be its 4th wave. If the first is true we are to see a breakout to the upside above the mentioned horizontal resistance but if the second is true we are to see a breakout below the support level of the current ascending triangle leading the price potentially all the way down to $2.11 level.
FXOpen offers the world's most popular cryptocurrency CFDs*, including Bitcoin and Ethereum. Floating spreads, 1:2 leverage — at your service (additional fees may apply). Open your trading account now or learn more about crypto CFD trading with FXOpen.
*Important: At FXOpen UK, Cryptocurrency trading via CFDs is only available to our Professional clients. They are not available for trading by Retail clients. To find out more information about how this may affect you, please get in touch with our team.
This article represents the opinion of the Companies operating under the FXOpen brand only. It is not to be construed as an offer, solicitation, or recommendation with respect to products and services provided by the Companies operating under the FXOpen brand, nor is it to be considered financial advice.
Stay ahead of the market!
Subscribe now to our mailing list and receive the latest market news and insights delivered directly to your inbox.


Latest articles

DAX 40: consolidation amid technology sell-off
A wave of selling in the technology sector that emerged earlier this week has weighed on European equities. The trigger was investor concern over the profitability of large-scale debt-funded investments by major US tech companies in AI infrastructure. The Nasdaq

Euro Hits Fresh Yearly Lows Amid Dovish ECB Signals
The euro remains under pressure following weak macroeconomic data from the euro area and fresh signals that the European Central Bank is prepared to maintain a more accommodative monetary policy stance. Data released yesterday pointed to a deterioration in business

Pound at Key Levels: Markets Assess Impact of Political Uncertainty in the UK
The British pound remains under pressure following increased political uncertainty in the United Kingdom triggered by the Prime Minister’s resignation. Investors are assessing potential shifts in the political and economic policy outlook after the head of government stepped down,