


LTC and EOS - Breakout to the downside
FXOpen
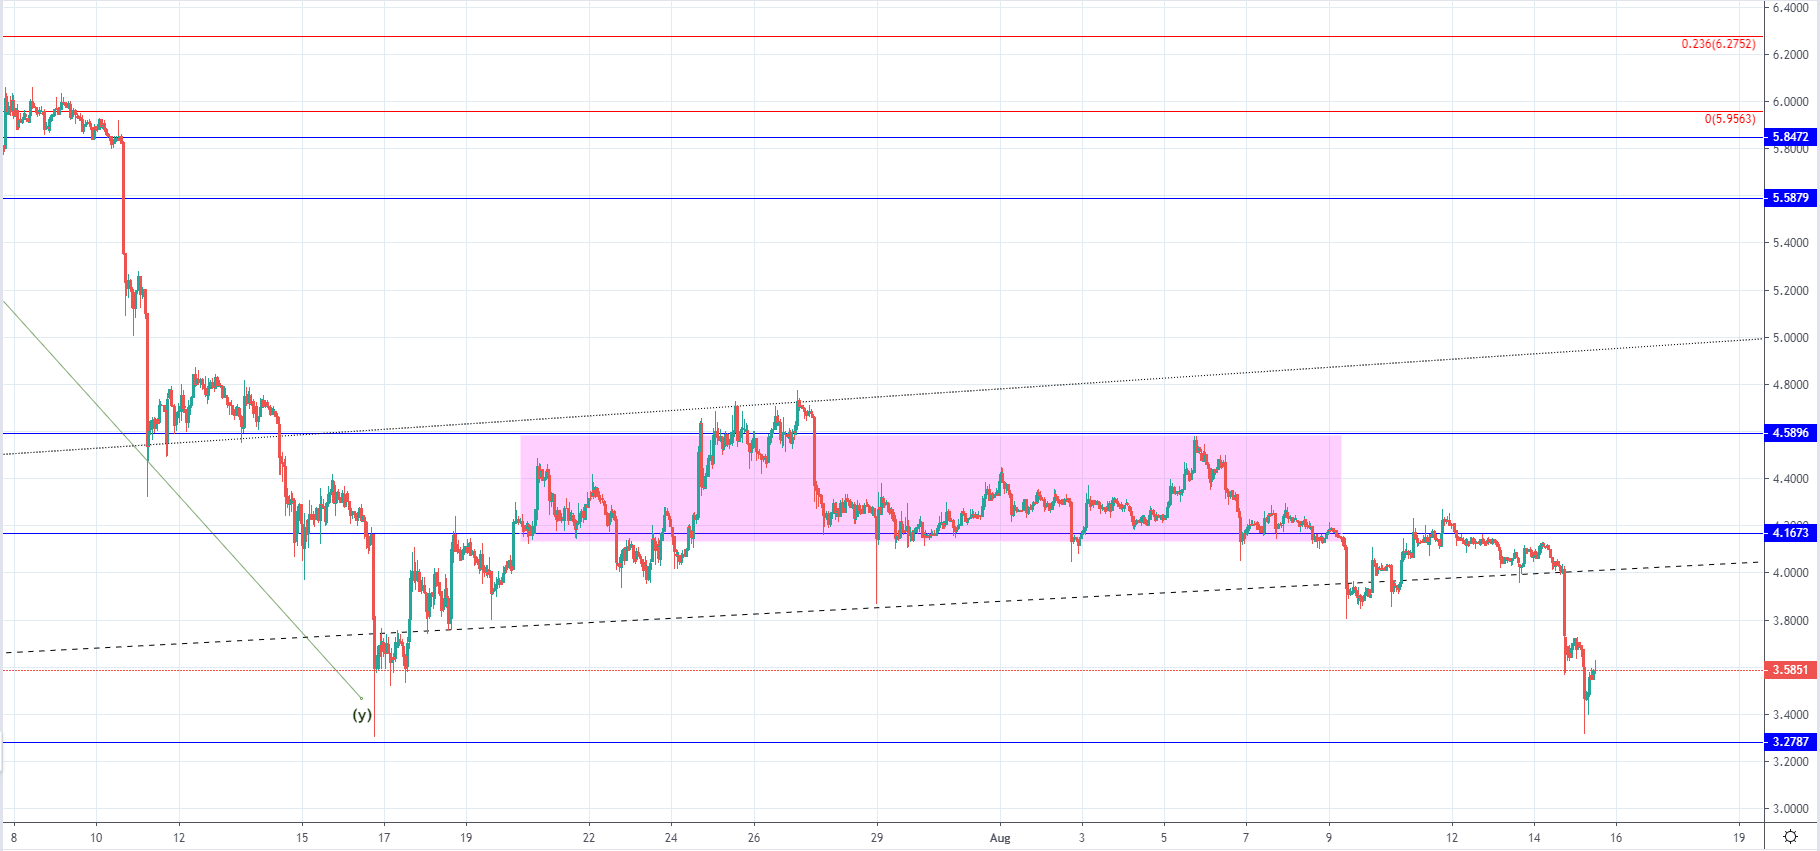
LTC/USD
On Monday, the price of Litecoin has been traded at $90.153 at its highest point but soon started decreasing to its significant horizontal support level at $84. As a breakout occurred from the horizontal support zone the price has fallen to $72.92 and spiked even further to $71.13 at its lowest point today which is a decrease of 21% since the start of the week.  On the hourly chart, you can see that the price broke out from the horizontal range in which it was consolidating from 17th of July. As you can see the price is currently slightly lower than it was on after it fell below the horizontal zone previously which indicates further downside potential as a lower low has been made. This downtrend is likely a continuation of the higher degree downside move which started on 12 of June when the price of Litecoin reached $144 at its highest point.
As we’ve seen a breakout to the downside the next horizontal level which could serve as support would be at around $67.9 but the level is only a minor one which is why I don’t believe that we are going to see it holding the downward momentum. More likely this support point is to cause a temporary reversal which would be set to push the price back up for a retest of the broken significant horizontal zone at $84 before the downside movement continues below it to the next significant support zone which is at around $54-52 area.
EOS/USD
From Monday’s high at $4.239 the price of EOS has decreased by 22.12% as it fell to $3.3 at its lowest spike today. The price is currently being traded at around $3.59 as it started to recover but strong seller’s presence has been seen which is why the momentum is likely to continue.
 Looking at the hourly chart, you can see that the price broke out from the horizontal range in which it was consolidating from 17th of July but unlike in the case of Litecoin, it hasn’t exceeded the prior low. The hourly candles did close below but the lowest spike has come even slightly higher then the previous one and hasn’t gone below $3.27 horizontal level. Even though the price hasn’t made a lower low we could say that we’ve seen a breakout to the downside as the significant ascending trendline has been broken which is why it is highly likely that the downfall would continue.
The price found some support but this is going to be a temporary one which could set the price for a minor recovery for a retest of the broken support levels for resistance after which another downturn would be seen.
FXOpen offers the world's most popular cryptocurrency CFDs*, including Bitcoin and Ethereum. Floating spreads, 1:2 leverage — at your service (additional fees may apply). Open your trading account now or learn more about crypto CFD trading with FXOpen.
*Important: At FXOpen UK, Cryptocurrency trading via CFDs is only available to our Professional clients. They are not available for trading by Retail clients. To find out more information about how this may affect you, please get in touch with our team.
This article represents the opinion of the Companies operating under the FXOpen brand only. It is not to be construed as an offer, solicitation, or recommendation with respect to products and services provided by the Companies operating under the FXOpen brand, nor is it to be considered financial advice.
Stay ahead of the market!
Subscribe now to our mailing list and receive the latest market news and insights delivered directly to your inbox.


Latest articles

DAX 40: consolidation amid technology sell-off
A wave of selling in the technology sector that emerged earlier this week has weighed on European equities. The trigger was investor concern over the profitability of large-scale debt-funded investments by major US tech companies in AI infrastructure. The Nasdaq

Euro Hits Fresh Yearly Lows Amid Dovish ECB Signals
The euro remains under pressure following weak macroeconomic data from the euro area and fresh signals that the European Central Bank is prepared to maintain a more accommodative monetary policy stance. Data released yesterday pointed to a deterioration in business

Pound at Key Levels: Markets Assess Impact of Political Uncertainty in the UK
The British pound remains under pressure following increased political uncertainty in the United Kingdom triggered by the Prime Minister’s resignation. Investors are assessing potential shifts in the political and economic policy outlook after the head of government stepped down,