


LTC and EOS - Bullish Momentum Picks Up
FXOpen

LTC/USD
From yesterday’s low at $51.7 the price of Litecoin has increased by 8.27% coming to $55.89 at its highest point today. Now the price is being traded slightly lower at around $55.5 but is still showing strong bullish momentum and is in an upward trajectory.
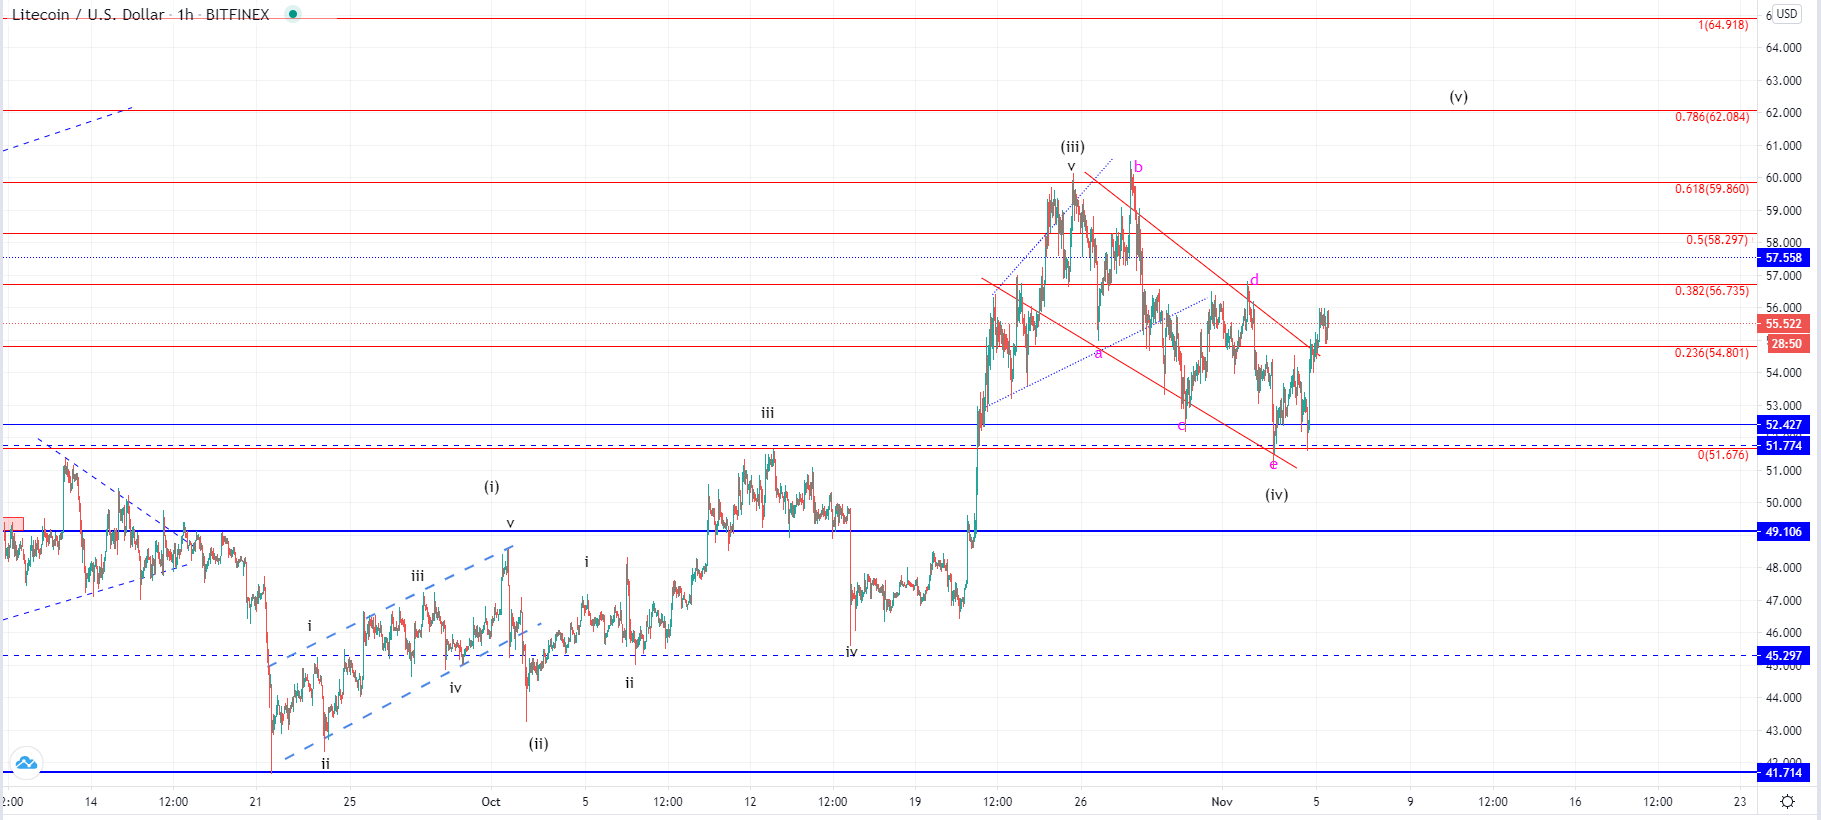
On the hourly chart, you can see that the price of Litecoin made an interaction with the 0 Fibonacci level at $51.67 on Tuesday from which it bounced but fell again yesterday for the second retest. As this second interaction ended by validating the support once more, a stronger move to the upside was seen. The price managed to move back up above the 0.236 Fibonacci line which served as another horizontal support level but was broken in a move to the downside.
As we have seen a significant recovery compared to the previous downfall from the interaction with the 0.382 Fib level, this could be an indication that the previous descending move ended. If this is true, then we have seen the completion of the ABCDE correction and the higher degree 4th wave. The descending trendline from its October’s high has been broken which could indicate that the development of the descending structure has been finished, so now if the price is developing its 5th wave we are to see a higher high then in October which was around $60.
EOS/USD
The price of EOS has increased by 5.73% from its yesterday’s low at $2.3 as it came up to $2.427 at its highest point today. Currently, a minor pullback has occurred with the price being traded at $2.378.
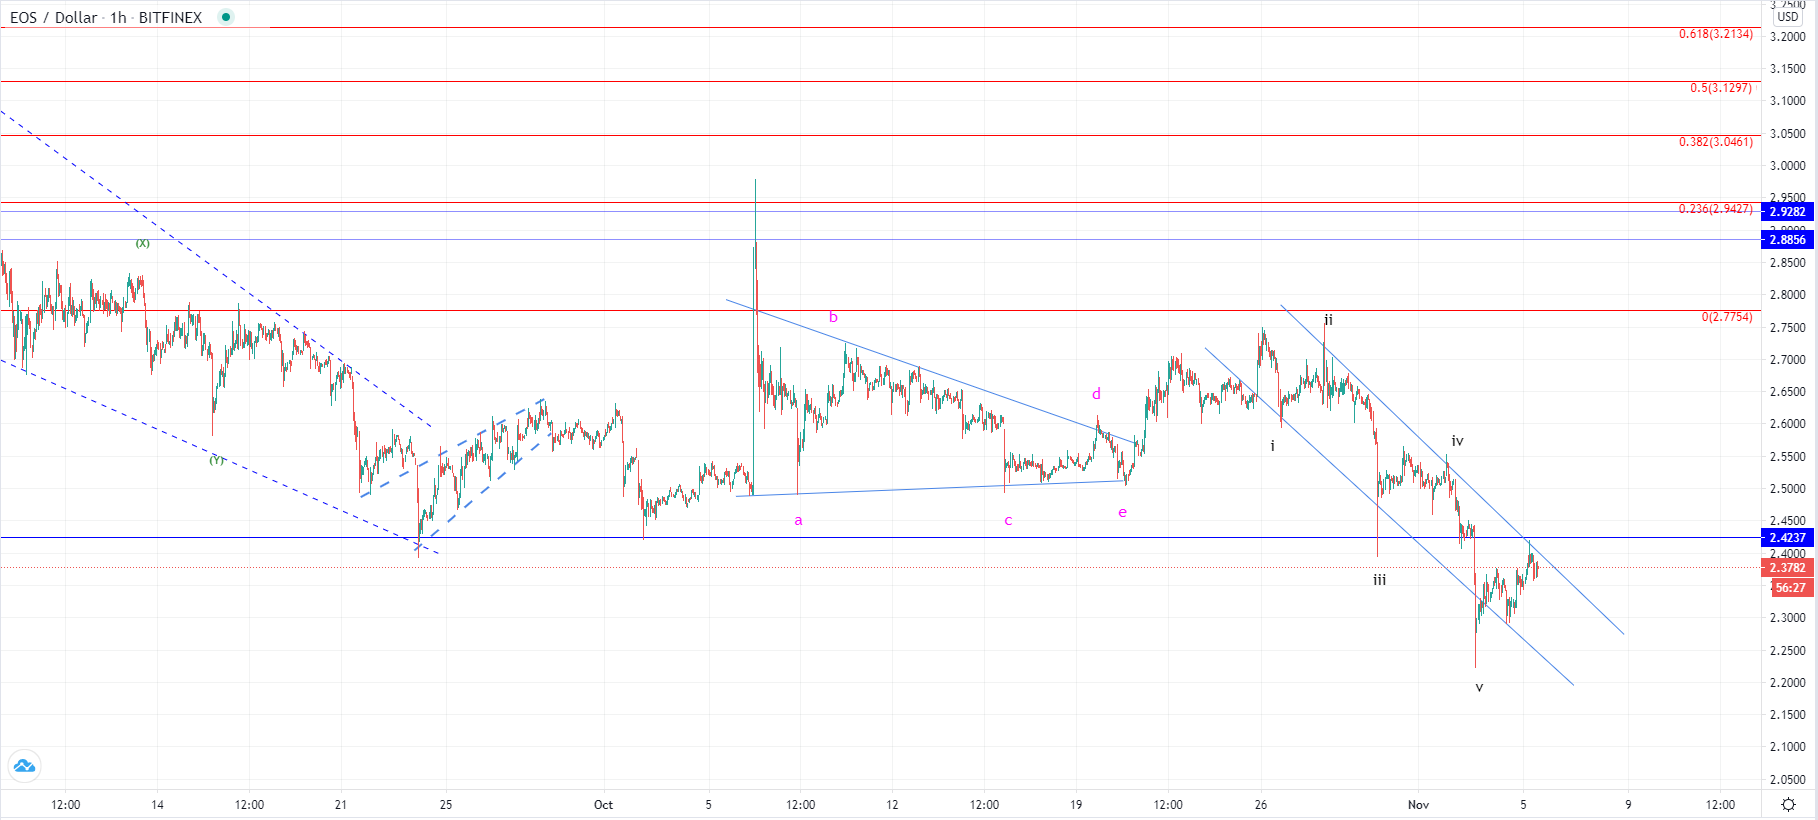
Looking at the hourly chart, you can see that the price broke down below the horizontal support at around $2.43 which was interacted with today from its lower side. This interaction most likely served as a validation of resistance and with a quick spike being made it appears that the resitance is present at those levels. The previous descending move was a five-wave one which could have been the C wave from the higher degree ABC correction of some kind, in which case the rise we have seen from yesterday could be the start of another significant recovery.
However, the price found resistance on the mentioned horizontal line and the descending channels resistance level exactly at the intersection which proved to be of significance. This is why we could have seen the completion of the 3rd of the higher degree count out of the five-wave impulse to the downside instead of the finishing C wave. In that case, the rise we have seen from yesterday would be the completion of the 4th wave and would indicate that another one to the downside is coming next.
If the price continues moving past the resistance point at the intersection of the significant lines, it would mean that the descending move ended, but if it get rejected from here, further lows would be more likely.
FXOpen offers the world's most popular cryptocurrency CFDs*, including Bitcoin and Ethereum. Floating spreads, 1:2 leverage — at your service (additional fees may apply). Open your trading account now or learn more about crypto CFD trading with FXOpen.
*Important: At FXOpen UK, Cryptocurrency trading via CFDs is only available to our Professional clients. They are not available for trading by Retail clients. To find out more information about how this may affect you, please get in touch with our team.
This article represents the opinion of the Companies operating under the FXOpen brand only. It is not to be construed as an offer, solicitation, or recommendation with respect to products and services provided by the Companies operating under the FXOpen brand, nor is it to be considered financial advice.
Stay ahead of the market!
Subscribe now to our mailing list and receive the latest market news and insights delivered directly to your inbox.


Latest articles

DAX 40: consolidation amid technology sell-off
A wave of selling in the technology sector that emerged earlier this week has weighed on European equities. The trigger was investor concern over the profitability of large-scale debt-funded investments by major US tech companies in AI infrastructure. The Nasdaq

Euro Hits Fresh Yearly Lows Amid Dovish ECB Signals
The euro remains under pressure following weak macroeconomic data from the euro area and fresh signals that the European Central Bank is prepared to maintain a more accommodative monetary policy stance. Data released yesterday pointed to a deterioration in business

Pound at Key Levels: Markets Assess Impact of Political Uncertainty in the UK
The British pound remains under pressure following increased political uncertainty in the United Kingdom triggered by the Prime Minister’s resignation. Investors are assessing potential shifts in the political and economic policy outlook after the head of government stepped down,