


FXOpen

LTC/USD
From yesterday’s low at $59.3 the price of Litecoin has increased by 6.58% today measured to the daily high at $63.24 around which the price is currently being traded. Bullish momentum has been caught with the price being in an upward trajectory but is now retesting the current levels for resistance.
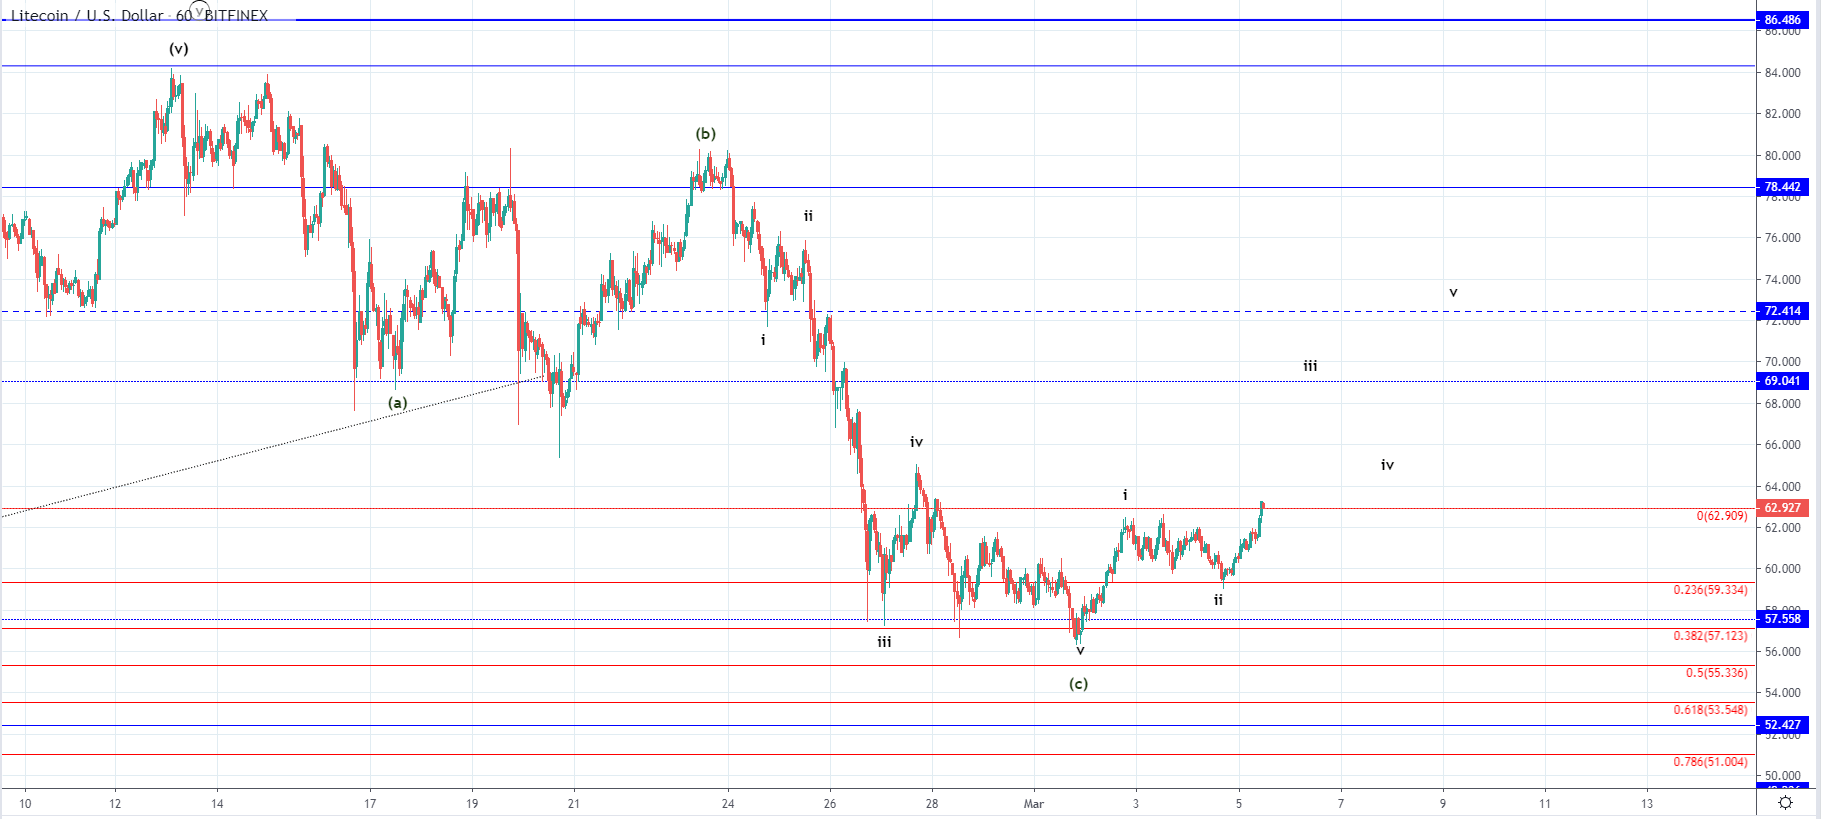
Looking at the hourly chart, you can see that yesterday’s low was an interaction with the 0.236 Fibonacci level on which the price found support and bounce off of it but has now come up to the starting Fib level where it is finding resistance. As you can see the price made it past the horizontal level but that doesn’t mean that we have seen a breakout to the upper range as the increase has been stopped out.
We could have seen the completion of the ABC correction to the downside on the interaction with the 0.382 Fibonacci level made on Sunday 1st of March. If this is true then the move which is currently developing would be the next starting five-wave impulse to the upside. This means that according to this projection we could expect to see further price appreciation to the $72.4 horizontal level before the ending of its fifth wave.
But if the ABC correction hasn’t ended on Sunday’s low the increase we are currently seeing would be the 4th wave of the five-wave move to the downside which is the C wave of the mentioned correction. Looking at the wave structure this isn’t as likely, but there is still a possibility of another lower low before the start of the now presumed five-wave impulse to the upside.
EOS/USD
The price of EOS has also been increasing from yesterday’s low at $3.56 and made a 4.75% increase as it came to $3.71 at its highest point today. Unlike the price of Litecoin we haven’t seen surpassing of the prior high but this price of EOS is still in an upward trajectory.
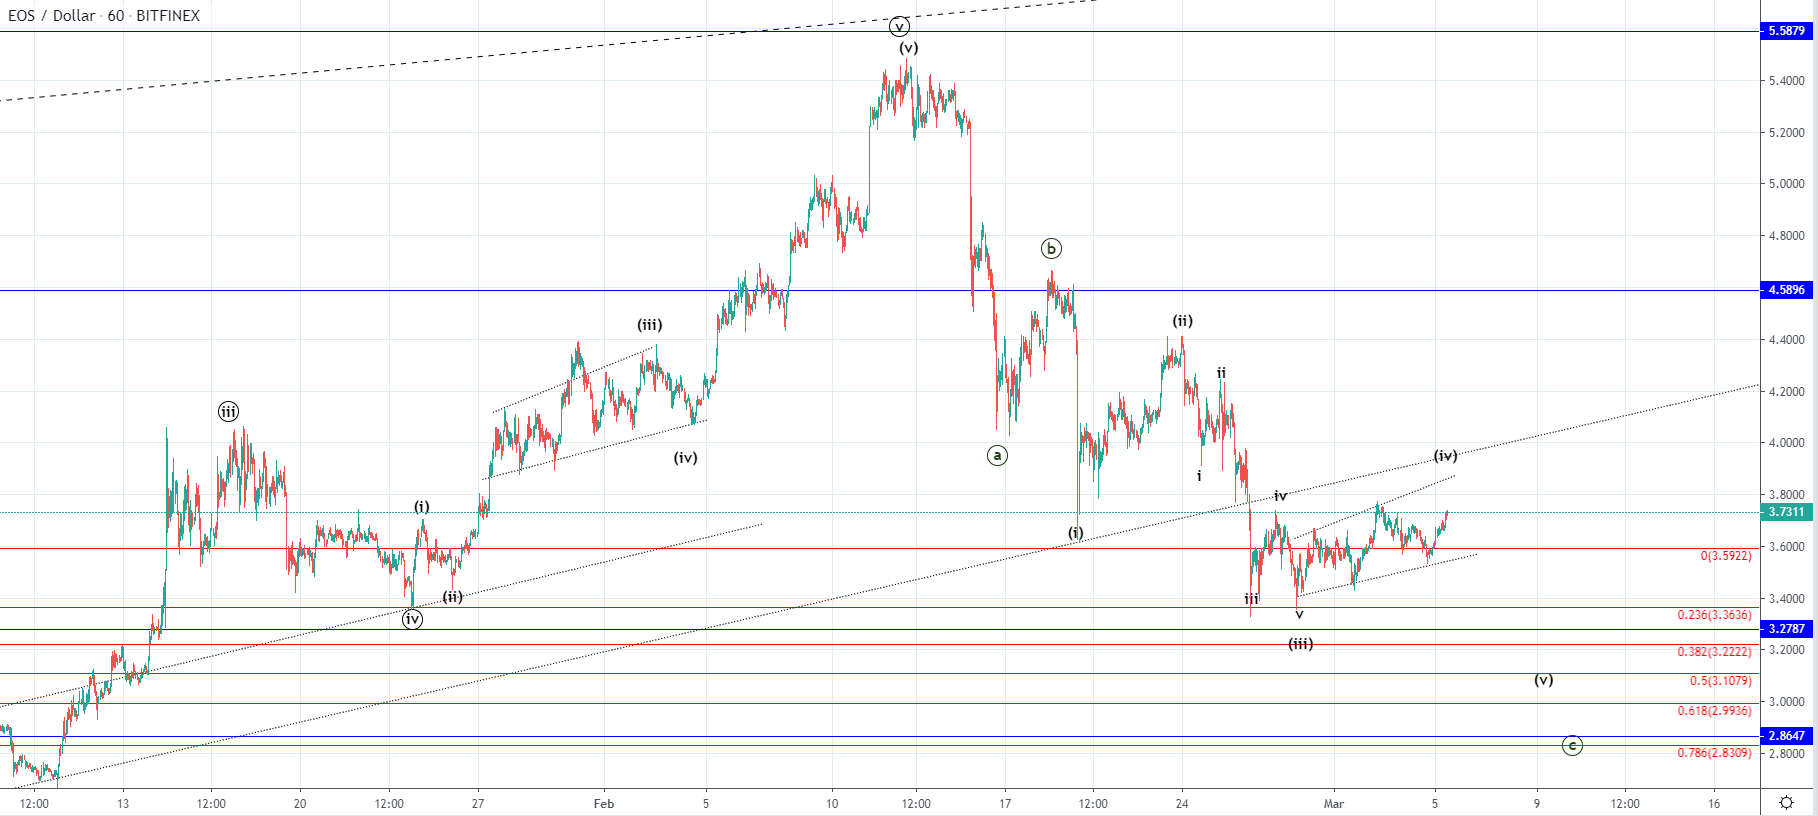
On the hourly chart, we can see that an ascending channel has started forming since the 28th of February when the price came down to $3.422 at it’s lowest point which was an interaction with the 0.236 Fibonacci level. This point could have been the ending point of the ABC correction to the downside like mentioned in the case of Litecoin, but on the chart of EOS, the wave structure implies likeliness to the alternative scenario in which we are seeing the development of the 4th wave from the C wave.
If this is true we could see a significant decrease from the current levels before another impulsive move to the upside starts, but this is soon to be validated.
FXOpen offers the world's most popular cryptocurrency CFDs*, including Bitcoin and Ethereum. Floating spreads, 1:2 leverage — at your service. Open your trading account now or learn more about crypto CFD trading with FXOpen.
*At FXOpen UK and FXOpen AU, Cryptocurrency CFDs are only available for trading by those clients categorised as Professional clients under FCA Rules and Professional clients under ASIC Rules respectively. They are not available for trading by Retail clients.
This article represents the opinion of the Companies operating under the FXOpen brand only. It is not to be construed as an offer, solicitation, or recommendation with respect to products and services provided by the Companies operating under the FXOpen brand, nor is it to be considered financial advice.
Stay ahead of the market!
Subscribe now to our mailing list and receive the latest market news and insights delivered directly to your inbox.

Latest articles

Weekly Market Wrap With Gary Thomson: Nasdaq, EUR/USD, USD/CHF, Brent Crude Oil, Googl Shares
Get the latest scoop on the week's hottest headlines, all in one convenient video. Join Gary Thomson, the COO of FXOpen UK, as he breaks down the most significant news reports and shares his expert insights.
- Nasdaq Composite: Worst Session

Analysis of AUD/USD: Exchange Rate Falls to Early May Low
As indicated by the 4-hour AUD/USD chart today:
→ the rate fell below 0.652, a level last seen on May 2;
→ the RSI indicator dropped below 15, a level last seen during the panic over the spread of COVID-19

Analysis of AMZN Stock: Price at 1.5-Month Low
As shown in the AMZN chart, the stock price dropped below:
→ the psychological level of $180;
→ the mid-June interim low.
The last time AMZN traded below $180 was in early June.
Thus, AMZN has faced sell-offs, similar to other tech