


LTC and EOS - Consolidation before a breakout
FXOpen

LTC/USD
From yesterday’s open when the price of Litecoin was being traded at $47.59 around its lowest point, we have seen an increase of around 4.4% as it came up to $49.58. At the moment the price is being traded slightly lower and is hovering at around $48.4 level.
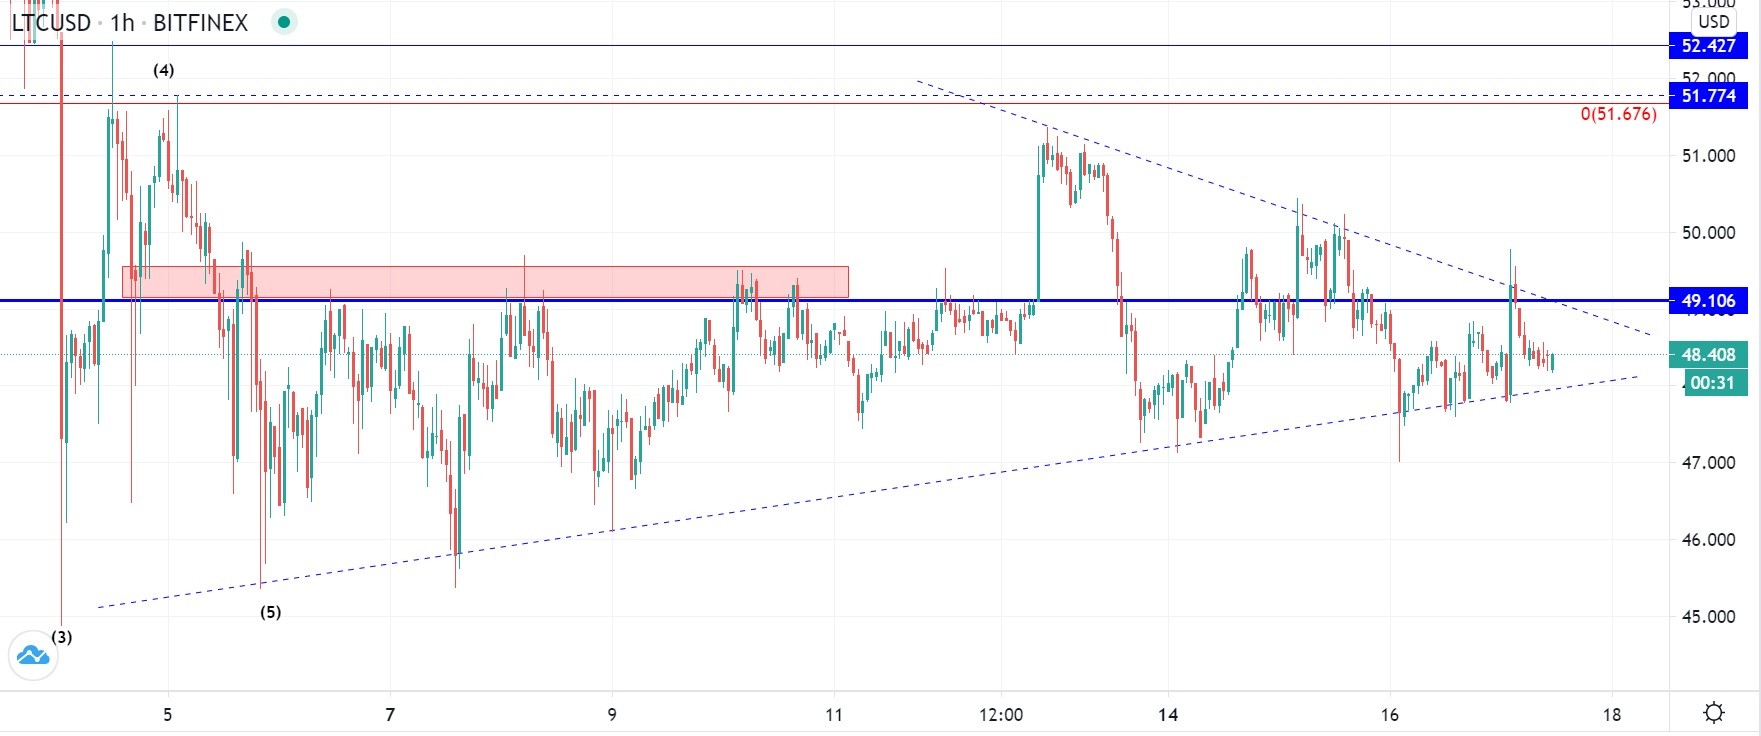
On the hourly chart, you can see that from today’s high when the price made an attempt to break out above its significant horizontal resistance we have seen a descending move. As an attempt for a breakout ended as a failure the price has been pushed back to the downside again but has still managed to maintain a higher point then on its lowest yesterday.
From the 4th of September when the price fell significantly to the downside we have seen the formation of the recovery with an ascending trendline making its baseline. As the price fell and retested it supports yesterday we are seeing the formation of a symmetrical triangle whose resistance level has started developing on the 12th of September.
The price is now likely to continue moving around the current levels of around $48.4 as that is the medial point of the formed triangle, but as it approaches its apex point a breakout to both sides can be equally possible.
If the corrective move from the higher degree ended on the 4th of September the breakout would be expected to develop to the upside, setting up the price of Litecoin for a more significant recovery.
EOS/USD
The price of EOS has been increasing from yesterday’s low at $2.599 and made a recovery of over 6.8% as it came up to $2.778 at its highest point today. Currently, it is being traded at $2.7119 and is in a downward trajectory.
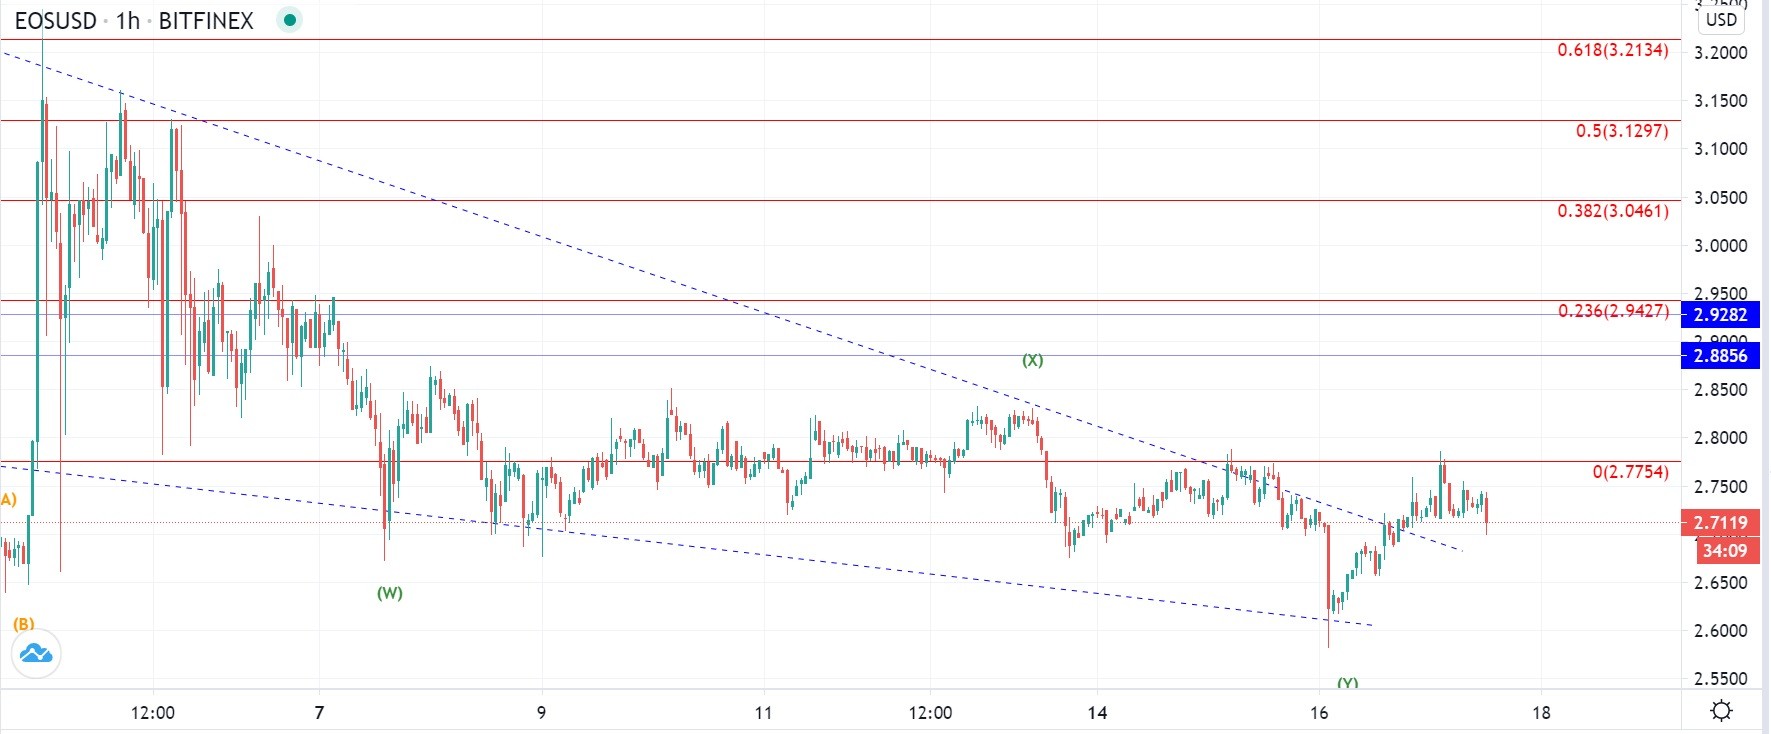
Looking at the hourly chart, you can see that it made a three-wave decrease since the 4th of September when it impulsively spiked to the upside buy after an interaction was made with the 0.618 Fibonacci level it started pulling back to the levels from which the increase was made.
This is why we have seen a retest of the $2.6 zone as it was the significant support area who which the price spiked impulsively, but unlike the previous time the price has increased now, it found resistance at the 0 Fib level and got rejected.
If we have seen the completion of the WXY correction on yesterday’s low followed by a breakout from the unclear descending triangle then the current descending move is to end on a higher low compared to yesterday’s one. But it should have ended on a higher high compared to the yesterday one but instead found resistance at the same level. This could indicate that the price is now headed for a lower low instead and would in that case mean that the prior correction hast ended.
FXOpen offers the world's most popular cryptocurrency CFDs*, including Bitcoin and Ethereum. Floating spreads, 1:2 leverage — at your service (additional fees may apply). Open your trading account now or learn more about crypto CFD trading with FXOpen.
*Important: At FXOpen UK, Cryptocurrency trading via CFDs is only available to our Professional clients. They are not available for trading by Retail clients. To find out more information about how this may affect you, please get in touch with our team.
This article represents the opinion of the Companies operating under the FXOpen brand only. It is not to be construed as an offer, solicitation, or recommendation with respect to products and services provided by the Companies operating under the FXOpen brand, nor is it to be considered financial advice.
Stay ahead of the market!
Subscribe now to our mailing list and receive the latest market news and insights delivered directly to your inbox.


Latest articles

DAX 40: consolidation amid technology sell-off
A wave of selling in the technology sector that emerged earlier this week has weighed on European equities. The trigger was investor concern over the profitability of large-scale debt-funded investments by major US tech companies in AI infrastructure. The Nasdaq

Euro Hits Fresh Yearly Lows Amid Dovish ECB Signals
The euro remains under pressure following weak macroeconomic data from the euro area and fresh signals that the European Central Bank is prepared to maintain a more accommodative monetary policy stance. Data released yesterday pointed to a deterioration in business

Pound at Key Levels: Markets Assess Impact of Political Uncertainty in the UK
The British pound remains under pressure following increased political uncertainty in the United Kingdom triggered by the Prime Minister’s resignation. Investors are assessing potential shifts in the political and economic policy outlook after the head of government stepped down,