


FXOpen

LTC/USD
The price of Litecoin has been increasing since the start of the week and from Monday’s low at $79.215 we have seen a rise of 29.75% measured to its highest point today at $102.781. Currently, the price is being traded slightly lower as a minor pullback was made and is sitting just below the $100 mark.
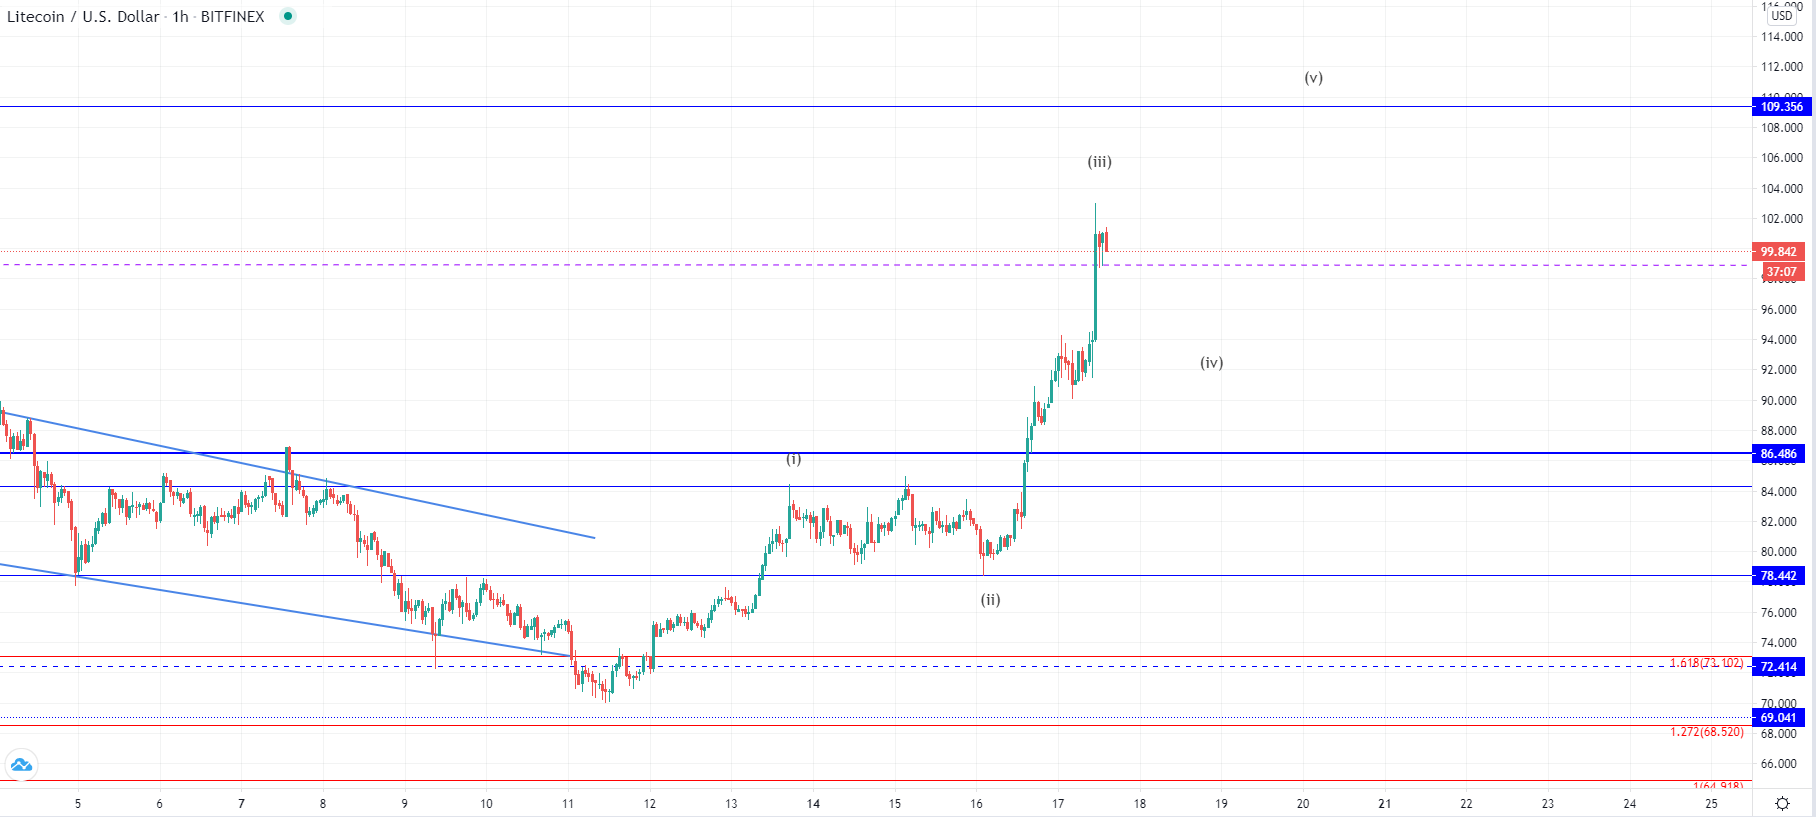
On the hourly chart, you can see that Monday’s low was a corrective move made after the interaction with the $84 horizontal level which was the end of the first impulse wave out of a five-wave move that started on the 11th. The second wave established support on the $78.44 level from which we have seen a parabolic rise with the price breaking significant resistance with a strong bullish moment.
As this increase was the 3rd wave which appears completed as it can be sub-divided in lower degree five-wave count, we are now likely to see a pullback to around $92 where the prior local resistance level might get tested for support. But after the pullback ends further upside movement would be expected and a higher high compared to today’s one. This expected increase would be the 5th wave that is set to push the price for a higher high and potentially to the $109.35 where the next significant horizontal resistance level is.
EOS/USD
From Monday’s low at $2.8 the price has increased by 13.46% as it came up to $3.182 at its highest point today. It is still in an upward trajectory and is showing strong bullish momentum.
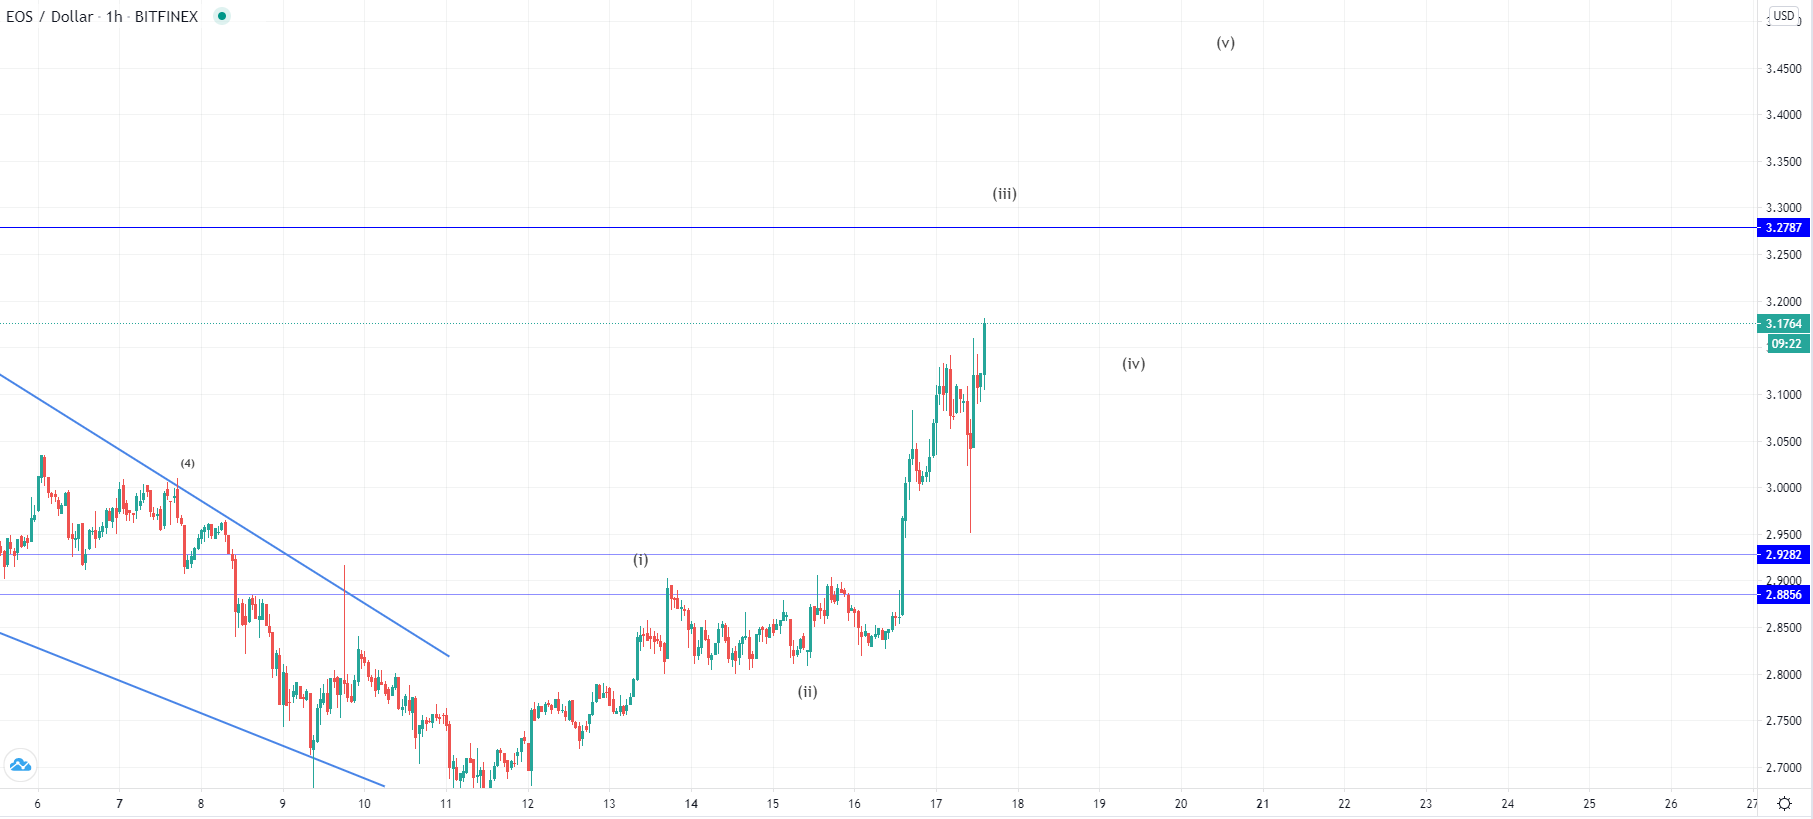
Looking at the hourly chart, you can see that the price made a breakout above the $2.9 resistance zone with a significant rise made in one hour and continued moving to the upside, further increasing inside the upper range. Like in the case of Litecoin, this increase seen from Monday is the 3rd wave out of the next five-wave impulse to the upside. Today we have seen a spike to the downside but shortly after the price continued increasing from which we can see that an attempt for the support to be established has successfully done.
Now we are likely to see the 3rd wave ending its development which is why shortly a corrective 4th wave would start. This would only be a minor consolidation before further upside movement as the 5t wave would follow to develop but it is still uncertain where the 3rd wave could end. Considering the vicinity of the $3.27 horizontal level we might see interaction with it before the end of the current inrease. But in either way the price of EOS would be expected to surpass it before the completion of the entire five-wave rise.
FXOpen offers the world's most popular cryptocurrency CFDs*, including Bitcoin and Ethereum. Floating spreads, 1:2 leverage — at your service. Open your trading account now or learn more about crypto CFD trading with FXOpen.
*At FXOpen UK and FXOpen AU, Cryptocurrency CFDs are only available for trading by those clients categorised as Professional clients under FCA Rules and Professional clients under ASIC Rules respectively. They are not available for trading by Retail clients.
This article represents the opinion of the Companies operating under the FXOpen brand only. It is not to be construed as an offer, solicitation, or recommendation with respect to products and services provided by the Companies operating under the FXOpen brand, nor is it to be considered financial advice.
Stay ahead of the market!
Subscribe now to our mailing list and receive the latest market news and insights delivered directly to your inbox.

Latest articles

Weekly Market Wrap With Gary Thomson: Nasdaq, EUR/USD, USD/CHF, Brent Crude Oil, Googl Shares
Get the latest scoop on the week's hottest headlines, all in one convenient video. Join Gary Thomson, the COO of FXOpen UK, as he breaks down the most significant news reports and shares his expert insights.
- Nasdaq Composite: Worst Session

Analysis of AUD/USD: Exchange Rate Falls to Early May Low
As indicated by the 4-hour AUD/USD chart today:
→ the rate fell below 0.652, a level last seen on May 2;
→ the RSI indicator dropped below 15, a level last seen during the panic over the spread of COVID-19

Analysis of AMZN Stock: Price at 1.5-Month Low
As shown in the AMZN chart, the stock price dropped below:
→ the psychological level of $180;
→ the mid-June interim low.
The last time AMZN traded below $180 was in early June.
Thus, AMZN has faced sell-offs, similar to other tech