


LTC and EOS - Correction could have ended but further confirmation is needed
FXOpen

LTC/USD
The price of Litecoin has been on the rise since Tuesday when it fell down to $144.36. From there we have seen an increase of 21.5% measured to its highest point today at $175. A minor pullback was made but again a rise with the price currently sitting slightly lower than its highest point today.
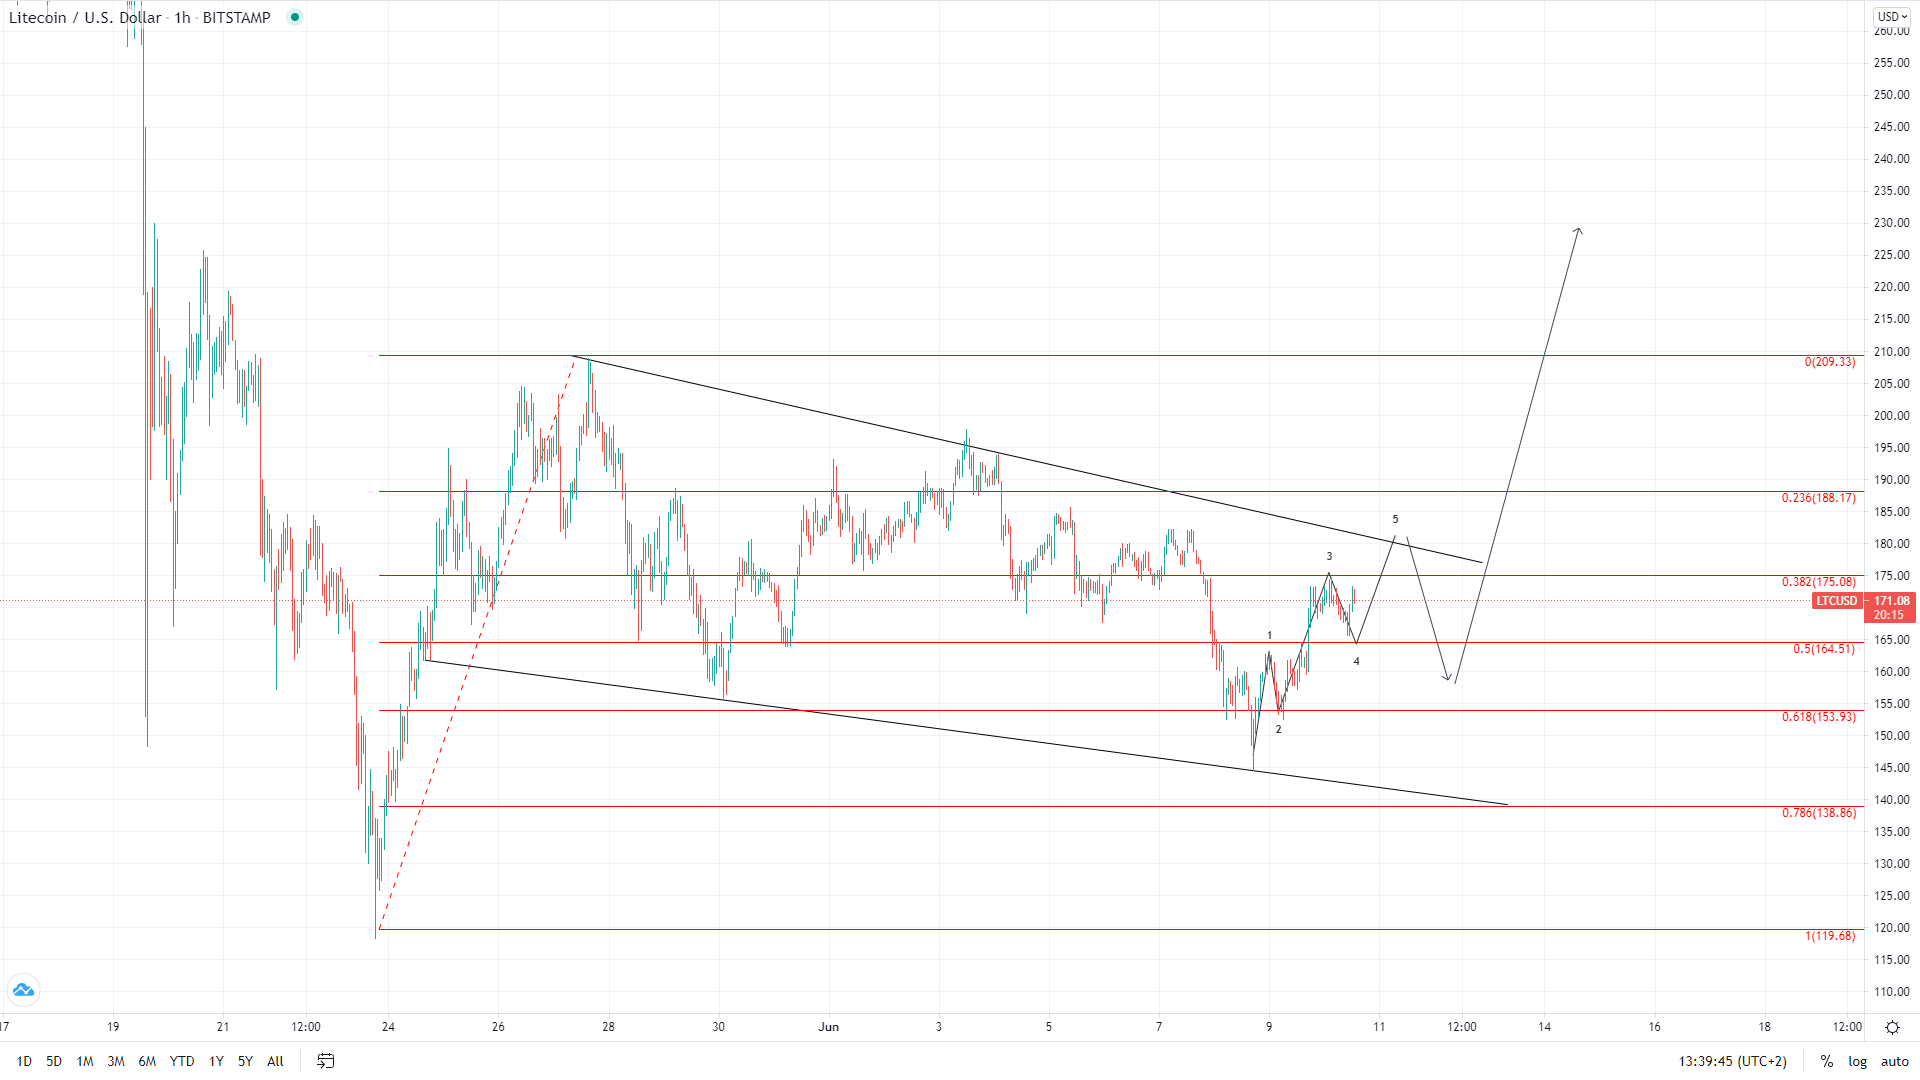
On the hourly chart, you can see that the price of Litecoin is still in a descending triangle from the 26th of May. Another interaction with its resistance level could be expected during the day as the 5th wave from the starting five-wave impulse from Tuesday. This could be the start of the higher degree upward move after the three-wave correction ended on the 8th in which case after a retracement we are to see a breakout from the upside.
The picture still looks corrective which is why we could be seeing the 4th wave out of the five-wave correction move from the 26th in which case the price of Litecoin could fall back to a lower low compared to the one on the 8th of June. This is why we are going to see from the interaction with the descending resistance if the price gets rejected and the depth of the expected retracement which scenario would be in play.
If it lands on the 0.5 Fib level or slightly lower and finds support there on the expected retracement that could be an early sign for a potential breakout to the upside.
EOS/USD
From the 8th of June, the price of EOS has recovered by 19.4% as it came up from $4.57 to $5.46 at its highest today. Now it is being traded slightly lower but is still in an upward trajectory.
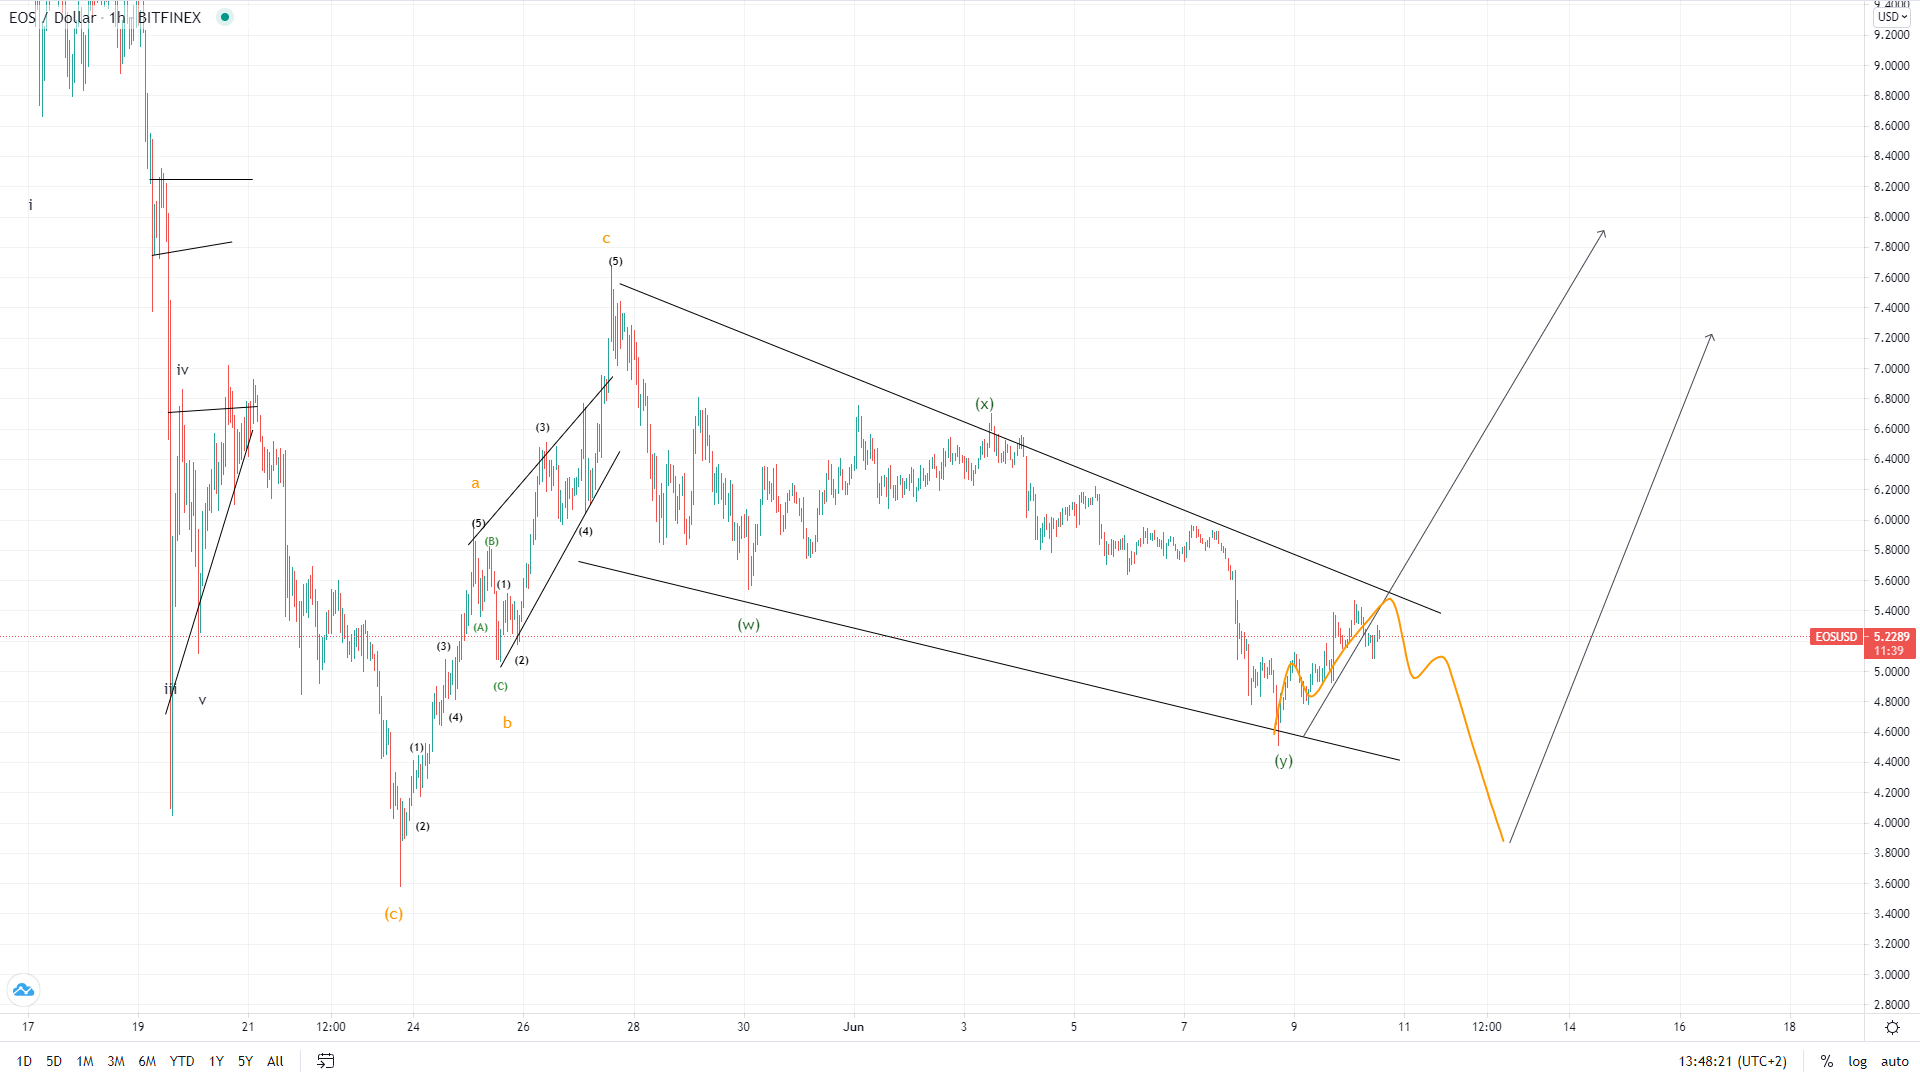 We can see a similar context on the EOS price chart as in the case of Litecoin. Namely from the 27th, we could have seen the completion of the three-wave correction in which case the price has started its first lower degree impulse to the upside that is going to lead the price to a higher high compared to the 27th. Another possibility could be this rise is the 4th wave out of the five-wave correction move in which case there is another lower low before the start of the expected rise.
This is why from the interaction with the descending resistance and the retracement that is expected to follow we are going to receive validation, but the strongest sign that the corrective stage is over would be a breakout from the triangle’s resistance.
This forecast represents FXOpen Markets Limited opinion only, it should not be construed as an offer, invitation or recommendation in respect to FXOpen Markets Limited products and services or as financial advice. Cryptocurrency CFDs are not available to trade in all jurisdictions.
FXOpen offers the world's most popular cryptocurrency CFDs*, including Bitcoin and Ethereum. Floating spreads, 1:2 leverage — at your service (additional fees may apply). Open your trading account now or learn more about crypto CFD trading with FXOpen.
*Important: At FXOpen UK, Cryptocurrency trading via CFDs is only available to our Professional clients. They are not available for trading by Retail clients. To find out more information about how this may affect you, please get in touch with our team.
This article represents the opinion of the Companies operating under the FXOpen brand only. It is not to be construed as an offer, solicitation, or recommendation with respect to products and services provided by the Companies operating under the FXOpen brand, nor is it to be considered financial advice.
Stay ahead of the market!
Subscribe now to our mailing list and receive the latest market news and insights delivered directly to your inbox.


Latest articles

DAX 40: consolidation amid technology sell-off
A wave of selling in the technology sector that emerged earlier this week has weighed on European equities. The trigger was investor concern over the profitability of large-scale debt-funded investments by major US tech companies in AI infrastructure. The Nasdaq

Euro Hits Fresh Yearly Lows Amid Dovish ECB Signals
The euro remains under pressure following weak macroeconomic data from the euro area and fresh signals that the European Central Bank is prepared to maintain a more accommodative monetary policy stance. Data released yesterday pointed to a deterioration in business

Pound at Key Levels: Markets Assess Impact of Political Uncertainty in the UK
The British pound remains under pressure following increased political uncertainty in the United Kingdom triggered by the Prime Minister’s resignation. Investors are assessing potential shifts in the political and economic policy outlook after the head of government stepped down,