


LTC and EOS - Correction developing
FXOpen

LTC/USD
From yesterday’s high at $78 the price of Litecoin has decreased by 10.51% as it came down to $69.82 at it’s lowest point today. The price is currently being traded around those levels as it’s attempting to establish some support.
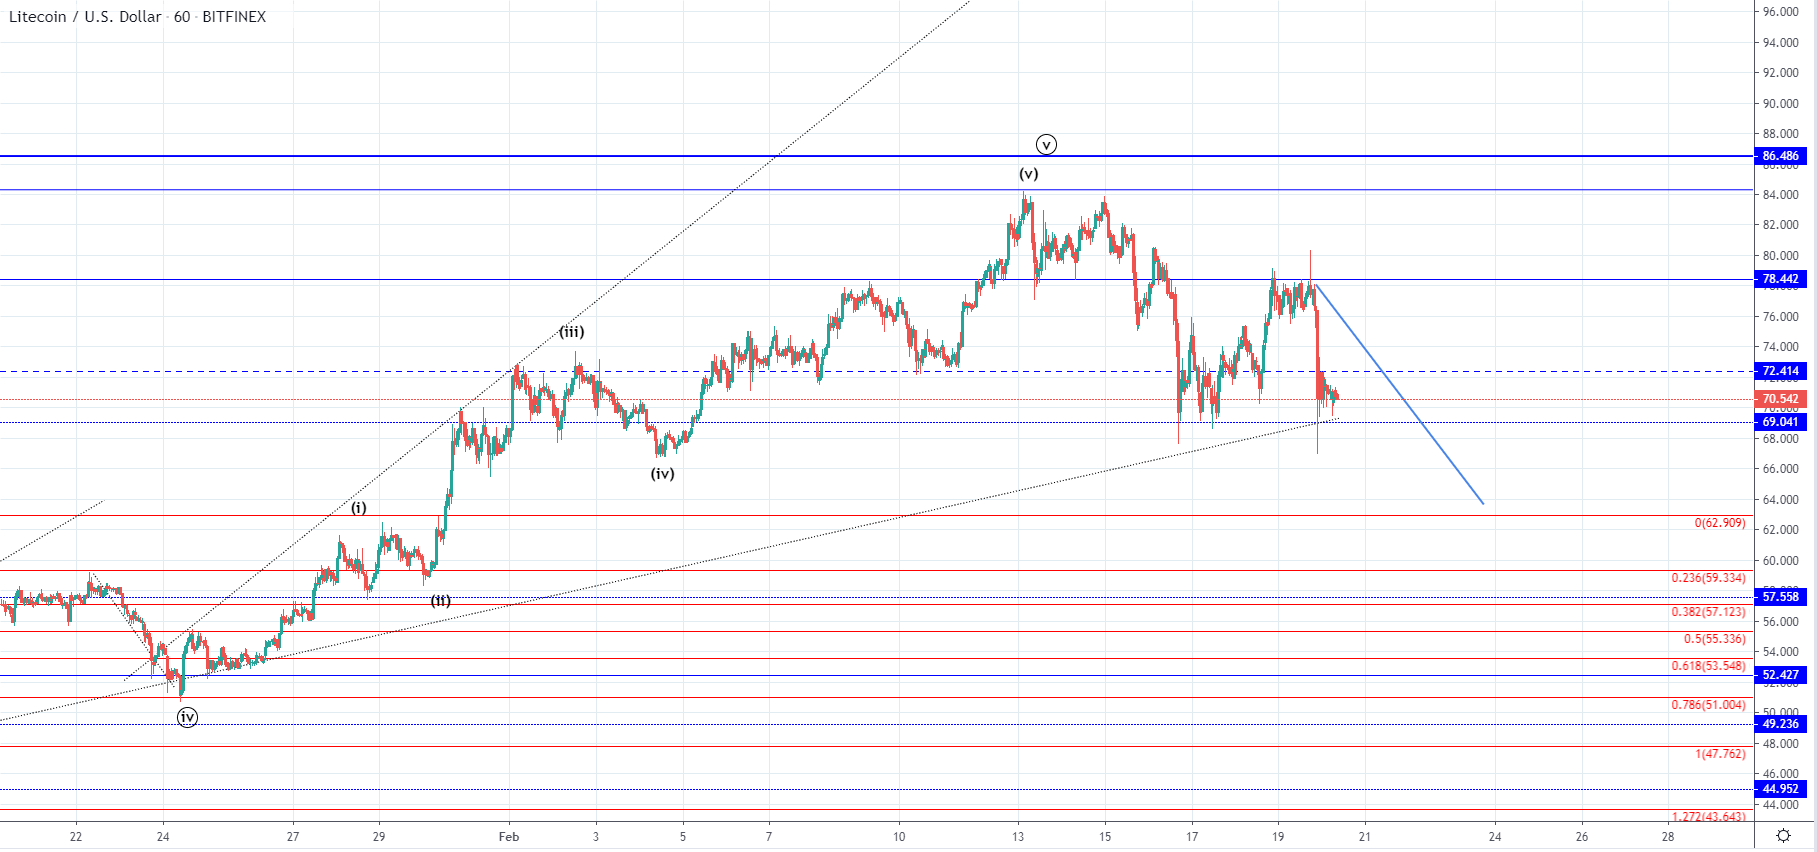
Looking at the hourly chart, we can see that the price came down to the ascending trendline and retested its intersection with the $69 horizontal level with a spike but the hourly candle closed above it leaving a large wick to the downside. This indicates that support is present at those levels but this might not be for much longer as we have seen strong bearish momentum since yesterday.
At the momentum, we can see a cluster being formed slightly above the prior low levels with a downward trajectory which can be interpreted as a sign of bearish pressure applied to the support levels below. This is why we are most likely to see a breakout to the downside with the price continuing to move below $69 level and potentially reach the 0 Fib level of the lower range which would bring the price of Litecoin at around $63.
If the price, however, manages to hold above the current levels a recovery could be seen but for now, it looks more likely that the price is to continue moving straight down as it came below the $72.414 horizontal level.
EOS/USD
The price of EOS has decreased by 18.93% since yesterday’s high at around $4.6 as it came down to $3.724 and even spiked further down. Since then we have seen a slight recovery with the price managing to stay above the $4 mark.
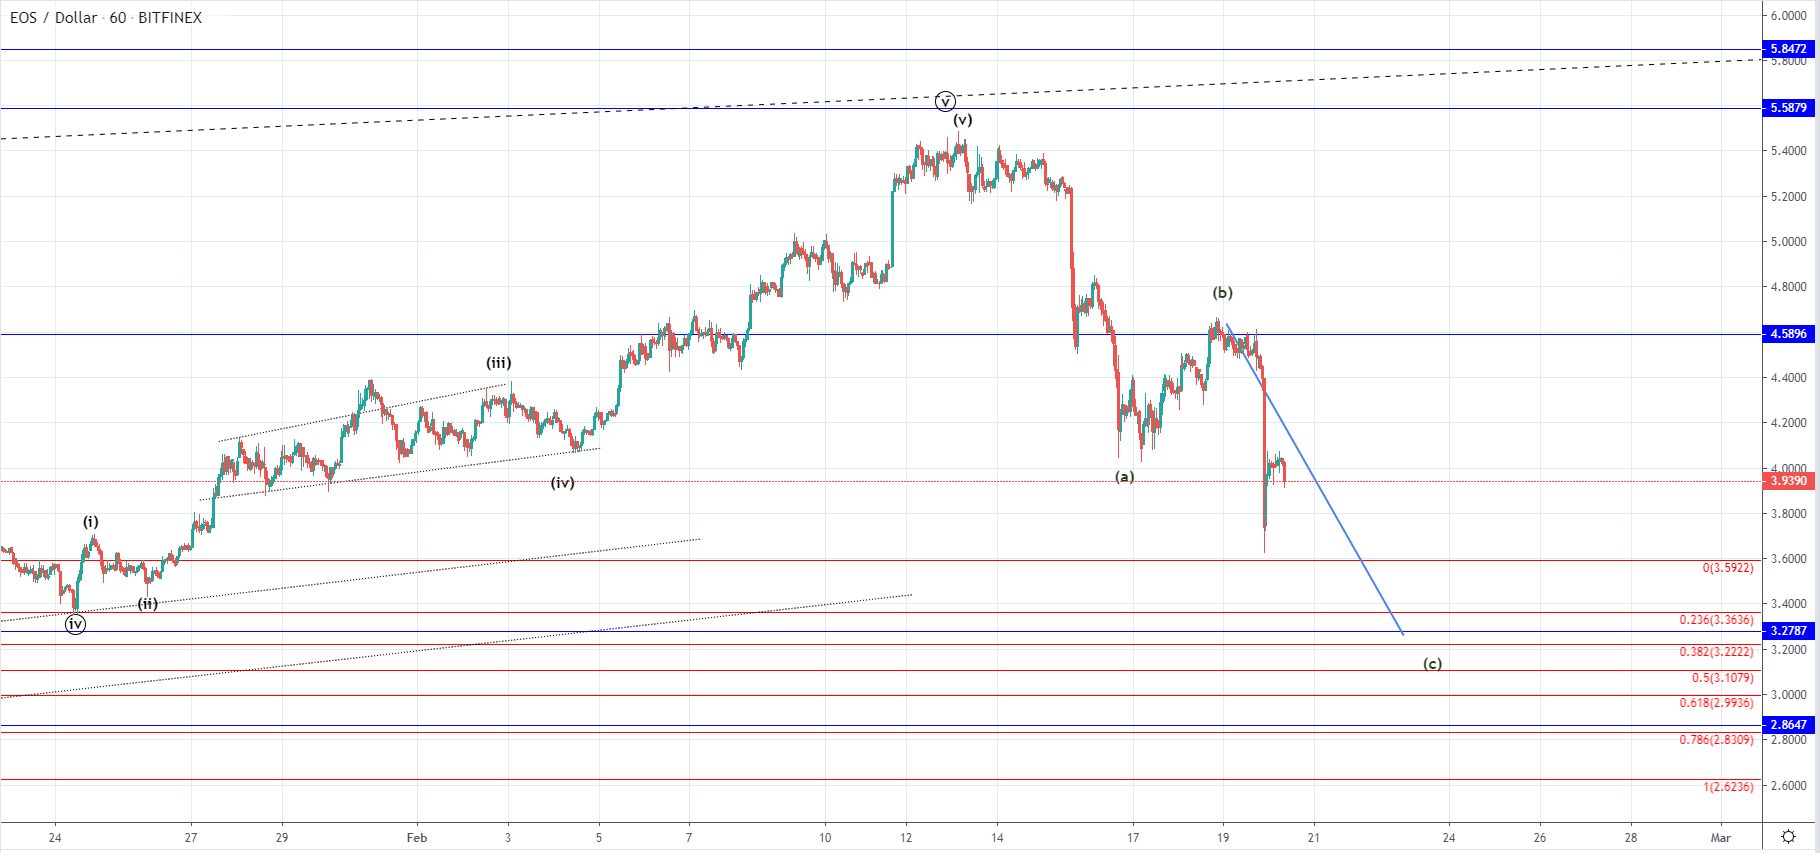
On the hourly chart, we can see that the price like in the case of Litecoin found support at the lower ascending trendline vicinity and came just above the 0 Fib level before it found support. The recovery that followed hasn’t made any major gains and is struggling to keep the price above $4.
If we have seen the completion of the B wave from the ABC correction the C wave is in development which is why further downside movement could be expected. Projecting the length of the A wave on to the B wave we come up with a target at around $3.28 horizontal level which is a significant one so we might see it’s retest before the completion of this descending move.
This decrease is considered a corrective one so further uptrend continuation would be expected after but in the meantime, we are yet to see where it ends.
FXOpen offers the world's most popular cryptocurrency CFDs*, including Bitcoin and Ethereum. Floating spreads, 1:2 leverage — at your service (additional fees may apply). Open your trading account now or learn more about crypto CFD trading with FXOpen.
*Important: At FXOpen UK, Cryptocurrency trading via CFDs is only available to our Professional clients. They are not available for trading by Retail clients. To find out more information about how this may affect you, please get in touch with our team.
This article represents the opinion of the Companies operating under the FXOpen brand only. It is not to be construed as an offer, solicitation, or recommendation with respect to products and services provided by the Companies operating under the FXOpen brand, nor is it to be considered financial advice.
Stay ahead of the market!
Subscribe now to our mailing list and receive the latest market news and insights delivered directly to your inbox.


Latest articles

US Dollar Strengthens Amid Equity Market Weakness and Hawkish Fed Rhetoric
The US dollar continues to hold firm near multi-year highs as sentiment across equity markets deteriorates and investors increasingly expect the Federal Reserve to maintain a restrictive monetary policy stance for longer. The US economy remains resilient, while inflation risks

Bitcoin: Corrective Channel Broken as Traders Turn More Active
Bitcoin has come under the influence of several factors simultaneously. The wave of selling at the beginning of June was linked to Strategy's first disclosed Bitcoin sale in several years, a prolonged series of outflows from spot ETFs, and a

DAX 40: consolidation amid technology sell-off
A wave of selling in the technology sector that emerged earlier this week has weighed on European equities. The trigger was investor concern over the profitability of large-scale debt-funded investments by major US tech companies in AI infrastructure. The Nasdaq