


LTC and EOS - Correction might have ended but downside potential still present
FXOpen
LTC/USD
The price of Litecoin has been on the rise since yesterday as it came from $118.1 to $132.15 which is an increase of 11.89%. Now it is being traded slightly lower but is still in an upward trajectory.
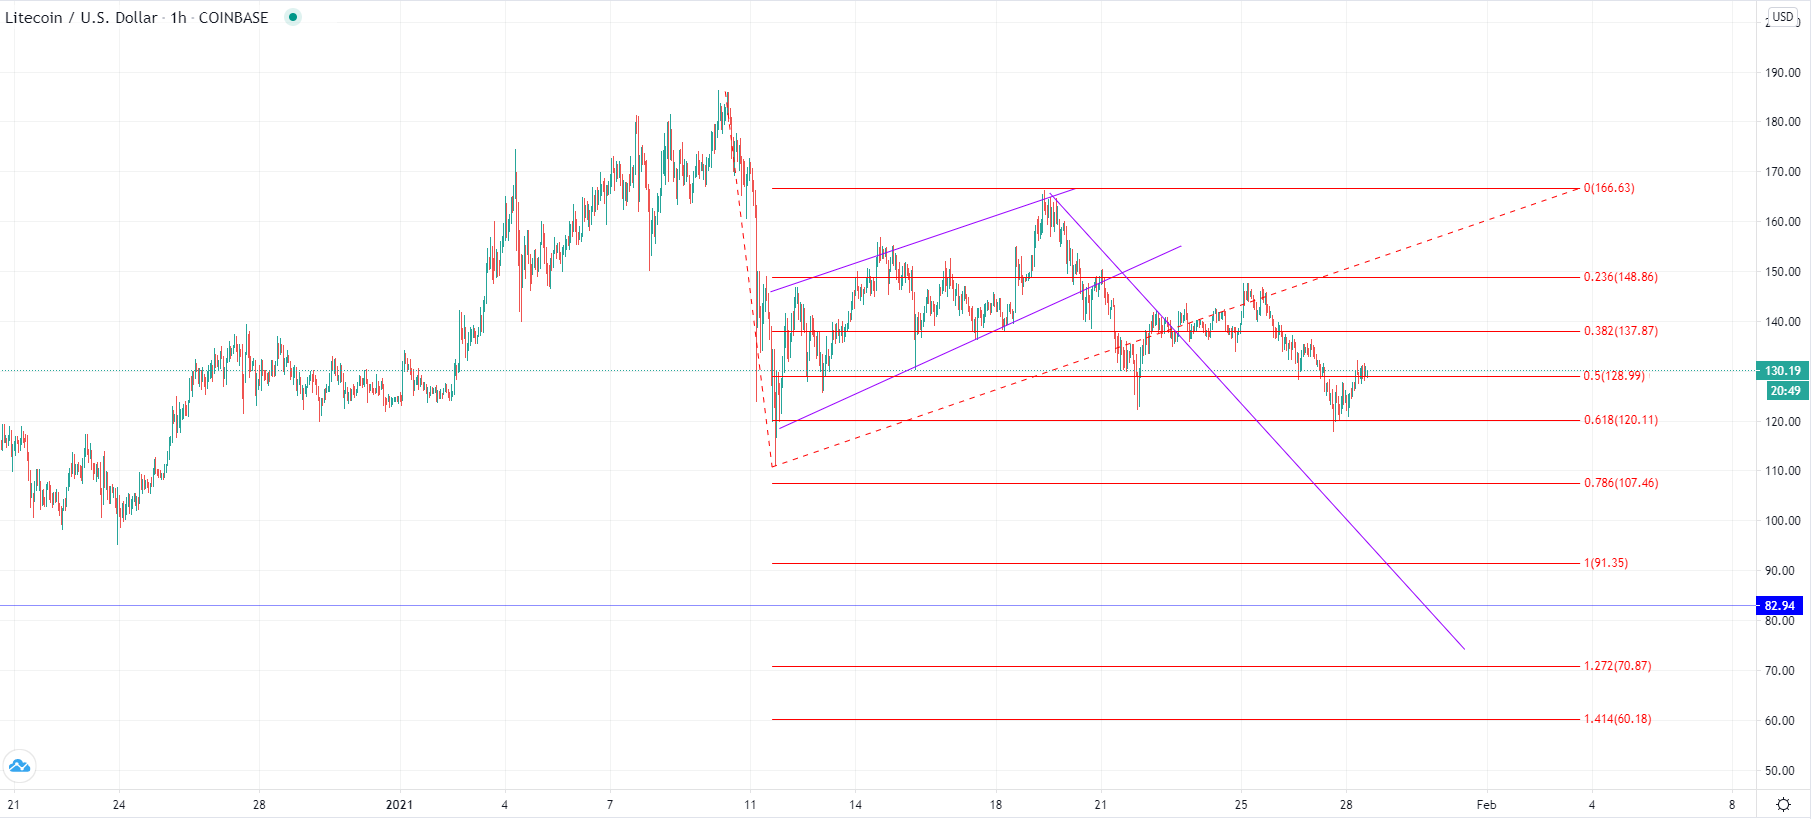
On the hourly chart, we can see that this recovery came after a decline of around 20.35% from its high on January 25th when it reached $147.8. This was the continuation of the descending move that started on the 7th of January and is part of the corrective structure of a higher degree count. The price found support on the 0.618 Fib extension level and is now looking for support on the 0.5.
If the support is present on those levels we could see the recovery continuing to move to the upside. But if the price doesn’t find support further downside movement could be seen. In either way, since this is the part of the higher degree correction we would expect further downside as there is still more room to go. If the price is to make a five-wave impulse that could be the C wave of the ABC correction we could see Litecoin being traded at around $75 area. However, we could be seeing a different correctional count in which case projecting the length of the first descending impulse we come up with the target of around $91.35.
EOS/USD
From yesterday’s low at $2.465 the price of EOS has increased by 13.61% as it came up to the $2.801 level at its highest point today. The price spiked impulsively to the upside but has since made a minor retracement to the $2.7134 level where it’s currently being traded.
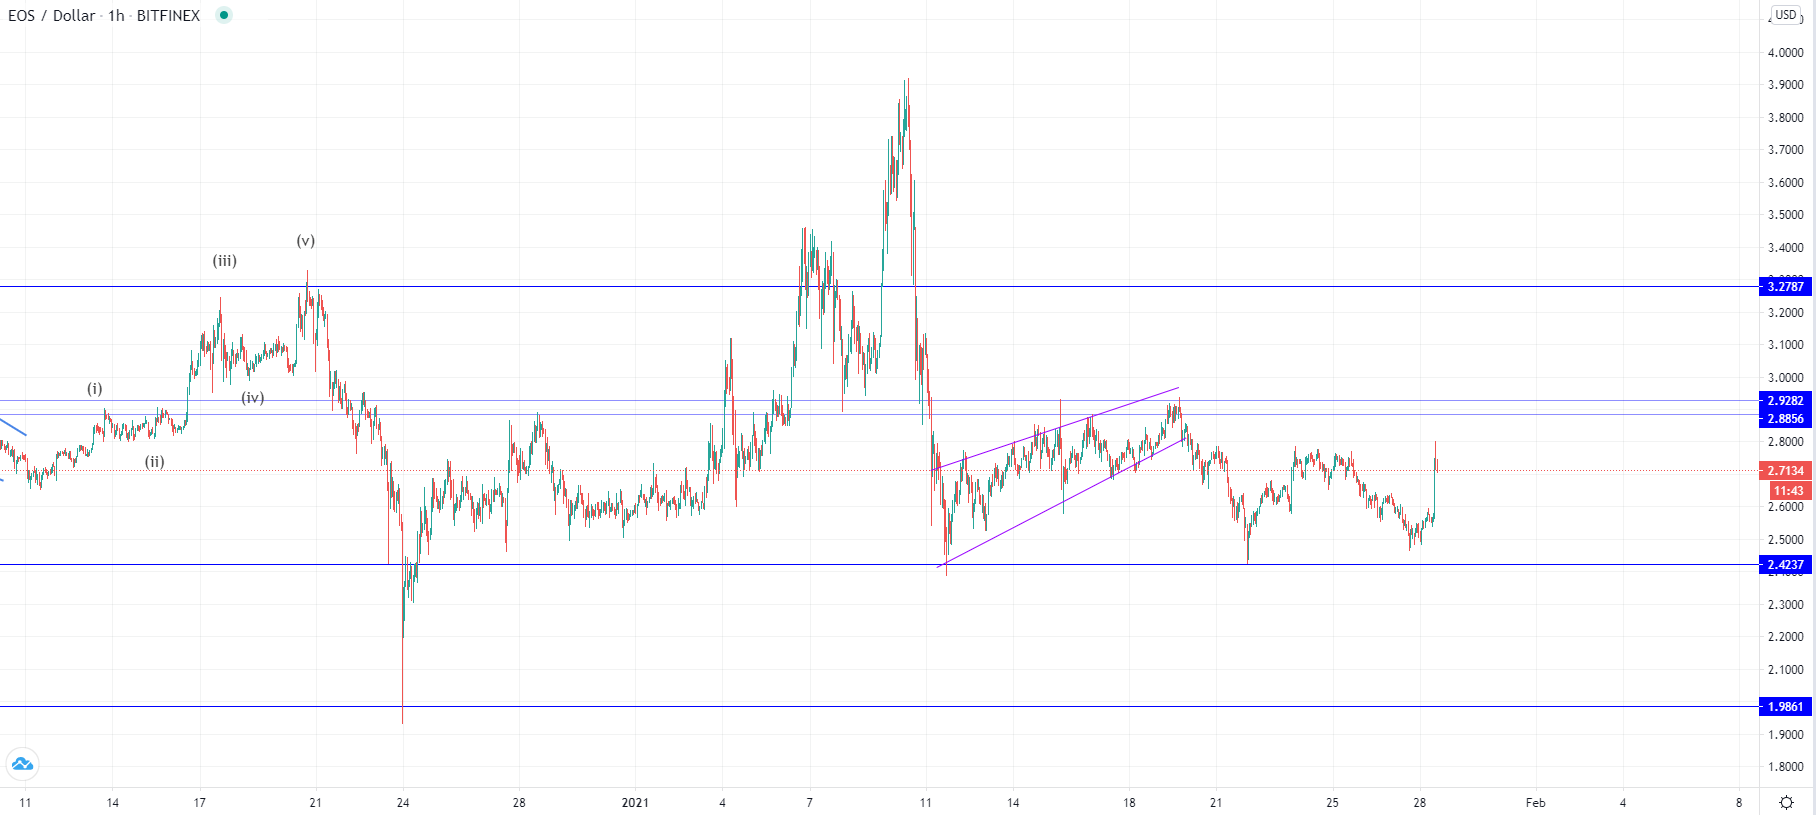
Looking at the hourly chart we can see that the price made a higher low yesterday and has attempted to make a higher high but failed to do so on the current rise. However, considering the impulsiveness seen this might change soon. From its high on the 10th of January made at $3.925 a strong descending move was made which could have been the starting point of the correctional higher degree move.
With the price currently testing the prior high which is the horizontal resistance, it might get rejected causing further downside continuation. In that case, we are to see an immediate retracement which will push the price further down breaking the horizontal support of $2.4237. But if it continues increasing from there it could indicate that the correction ended on the 22nd of January in which case yesterday’s low would be the 2nd wave out of the next five-wave impulse to the upside.
This forecast represents FXOpen Markets Limited opinion only, it should not be construed as an offer, invitation or recommendation in respect to FXOpen Markets Limited products and services or as financial advice.
Cryptocurrency CFDs are not available to trade in all jurisdictions.
FXOpen offers the world's most popular cryptocurrency CFDs*, including Bitcoin and Ethereum. Floating spreads, 1:2 leverage — at your service (additional fees may apply). Open your trading account now or learn more about crypto CFD trading with FXOpen.
*Important: At FXOpen UK, Cryptocurrency trading via CFDs is only available to our Professional clients. They are not available for trading by Retail clients. To find out more information about how this may affect you, please get in touch with our team.
This article represents the opinion of the Companies operating under the FXOpen brand only. It is not to be construed as an offer, solicitation, or recommendation with respect to products and services provided by the Companies operating under the FXOpen brand, nor is it to be considered financial advice.
Stay ahead of the market!
Subscribe now to our mailing list and receive the latest market news and insights delivered directly to your inbox.


Latest articles

Pound at Key Levels: Markets Assess Impact of Political Uncertainty in the UK
The British pound remains under pressure following increased political uncertainty in the United Kingdom triggered by the Prime Minister’s resignation. Investors are assessing potential shifts in the political and economic policy outlook after the head of government stepped down,

Silver: Fed Tightens Its Tone as Price Returns to the Volume Profile Zone
Silver came under pressure following the Federal Reserve’s June meeting, at which policymakers kept interest rates unchanged at 3.50–3.75%. Nine of the 18 committee members still see the possibility of a rate increase this year, reinforcing

Ethereum: Market Assesses the Strength of the Corrective Recovery
Following a period of heightened volatility in early June, investor attention in Ethereum has once again shifted towards institutional demand and the development of the spot ETF market in the United States. The funds launched last year continue to serve