


LTC and EOS - corrective retracement or downtrend continuation?
FXOpen

LTC/USD
From Sunday when the price of Litecoin was sitting at $49.551 we have seen a decrease of 11.23% measured to its lowest point today at $43.898. The price is currently being traded at $44.914 and is retesting the horizontal support for resistance as you can see from the hourly chart below. 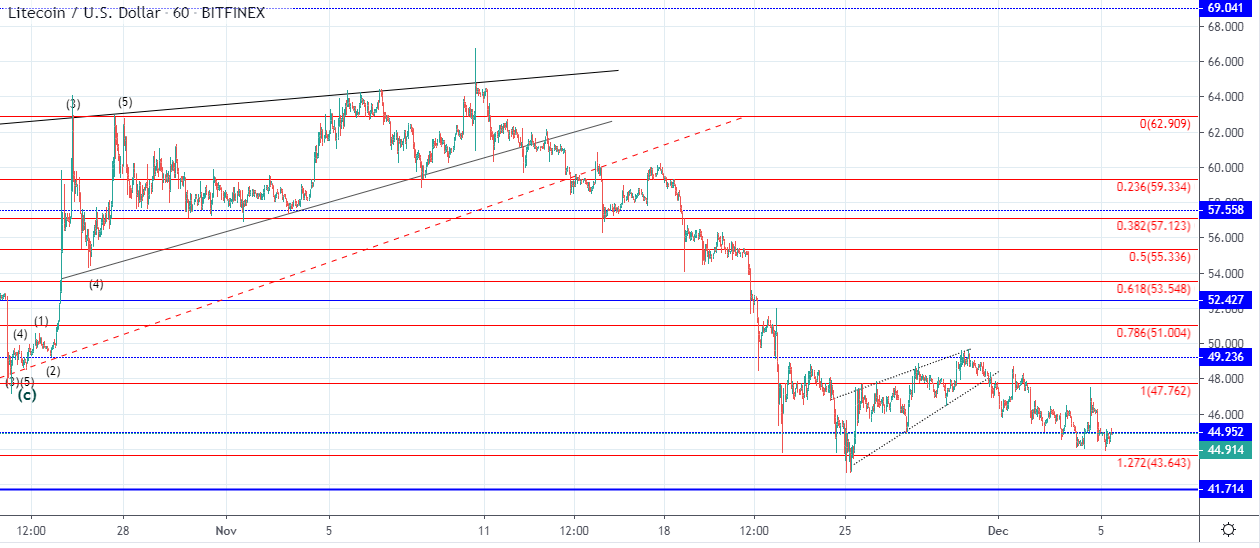 On the hourly chart, you can see that the price of Litecoin has retraced back almost to its prior low at $43.6 but hasn’t made an interaction with the 1.272 Fibonacci level. Instead after yesterday’s low the price spiked to the upside back to the 1 Fib level before again falling back down to the same level.
This price movement indicates that we are most likely seeing a corrective move to the downside after a breakout from the ascending triangle. The breakout momentum was strong which is why we could see the price continuing to form lower lows.
As the price is currently retesting the $44.952 horizontal level we are soon going to see if the resistance is there and if the interaction ends as a rejection further lows would looks highly likely. If the price however manages to go above the horizontal level and stays there it could be an early indication that the recovery has started with the ascending triangle being its first wave.
EOS/USD
The price of EOS has also broken out from its ascending range but fell only by 7.36% from its highest point on Sunday at $2.81 to 2.61. Like in the case of Litecoin the price spiked to the upside yesterday coming to retest the 0.786 resistance level but shortly fell back to the levels from which the increase was made. 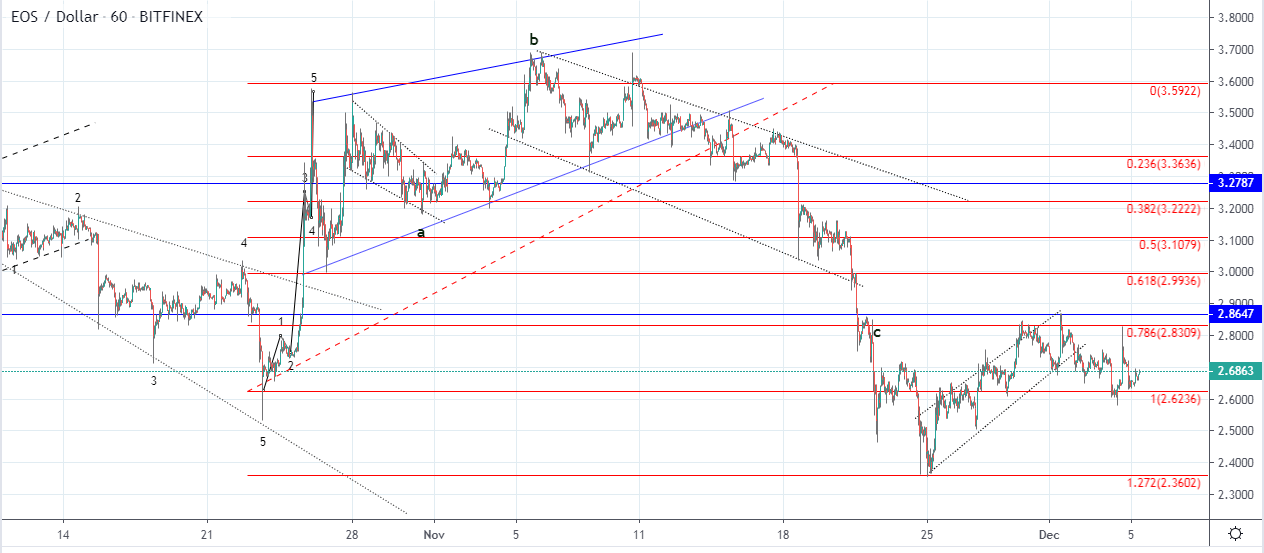 Looking at the hourly chart, we can see that the price of EOS formed an ascending channel in which the price moved in a five-wave manner. This could be interpreted as a leading diagonal especially considering that this occurred after an interaction with the 1.272 Fibonacci level and the decline from the breakout momentum out of the ascending triangle.
The price came down to the 1 Fibonacci level and found support there so if the increase continues without going below it, it could indicate further price appreciation. But if the price continues moving to the downside below the $2.62 level a retest of the 1.272 Fib level would look more likely with potential further lower lows.
In that case the ascending channel would have been corrective in nature and was not a leading diagonal which will be validated by the price depreciation above $2.36
FXOpen offers the world's most popular cryptocurrency CFDs*, including Bitcoin and Ethereum. Floating spreads, 1:2 leverage — at your service (additional fees may apply). Open your trading account now or learn more about crypto CFD trading with FXOpen.
*Important: At FXOpen UK, Cryptocurrency trading via CFDs is only available to our Professional clients. They are not available for trading by Retail clients. To find out more information about how this may affect you, please get in touch with our team.
This article represents the opinion of the Companies operating under the FXOpen brand only. It is not to be construed as an offer, solicitation, or recommendation with respect to products and services provided by the Companies operating under the FXOpen brand, nor is it to be considered financial advice.
Stay ahead of the market!
Subscribe now to our mailing list and receive the latest market news and insights delivered directly to your inbox.


Latest articles

Apple: Earnings Day Above the Activity Zone
On 30 April, after the market close, Apple Inc. will release its financial results for the second quarter of fiscal 2026. The consensus forecast, based on estimates from 31 analysts, points to revenue of around $109.7 billion, with expected

USD/JPY and USD/CHF Near Key Levels: The Dollar Supported by the Fed
The US dollar continues to trend upwards following the Federal Reserve meeting, drawing support from the regulator’s moderately hawkish stance and comments by Jerome Powell. Markets interpret the Fed’s rhetoric as a signal that restrictive policy is likely

EUR/USD and GBP/USD consolidate ahead of the Fed decision
European currencies are showing subdued dynamics, entering a consolidation phase following their previous advance. Earlier, EUR/USD and GBP/USD broke out of their ranges and strengthened; however, the subsequent correction has led both pairs to retest the previously breached