LTC and EOS - Downside expected
FXOpen

LTC/USD
From Monday when the price of Litecoin was sitting at $41.87 at its lowest point we have seen an increase of 7.77% measured to the weekly high made yesterday when the price came up to $45 level. Since then a slight retracement has been seen with the price going down to $43.1 at its lowest today but has managed to come up above $44 mark where its currently being traded.
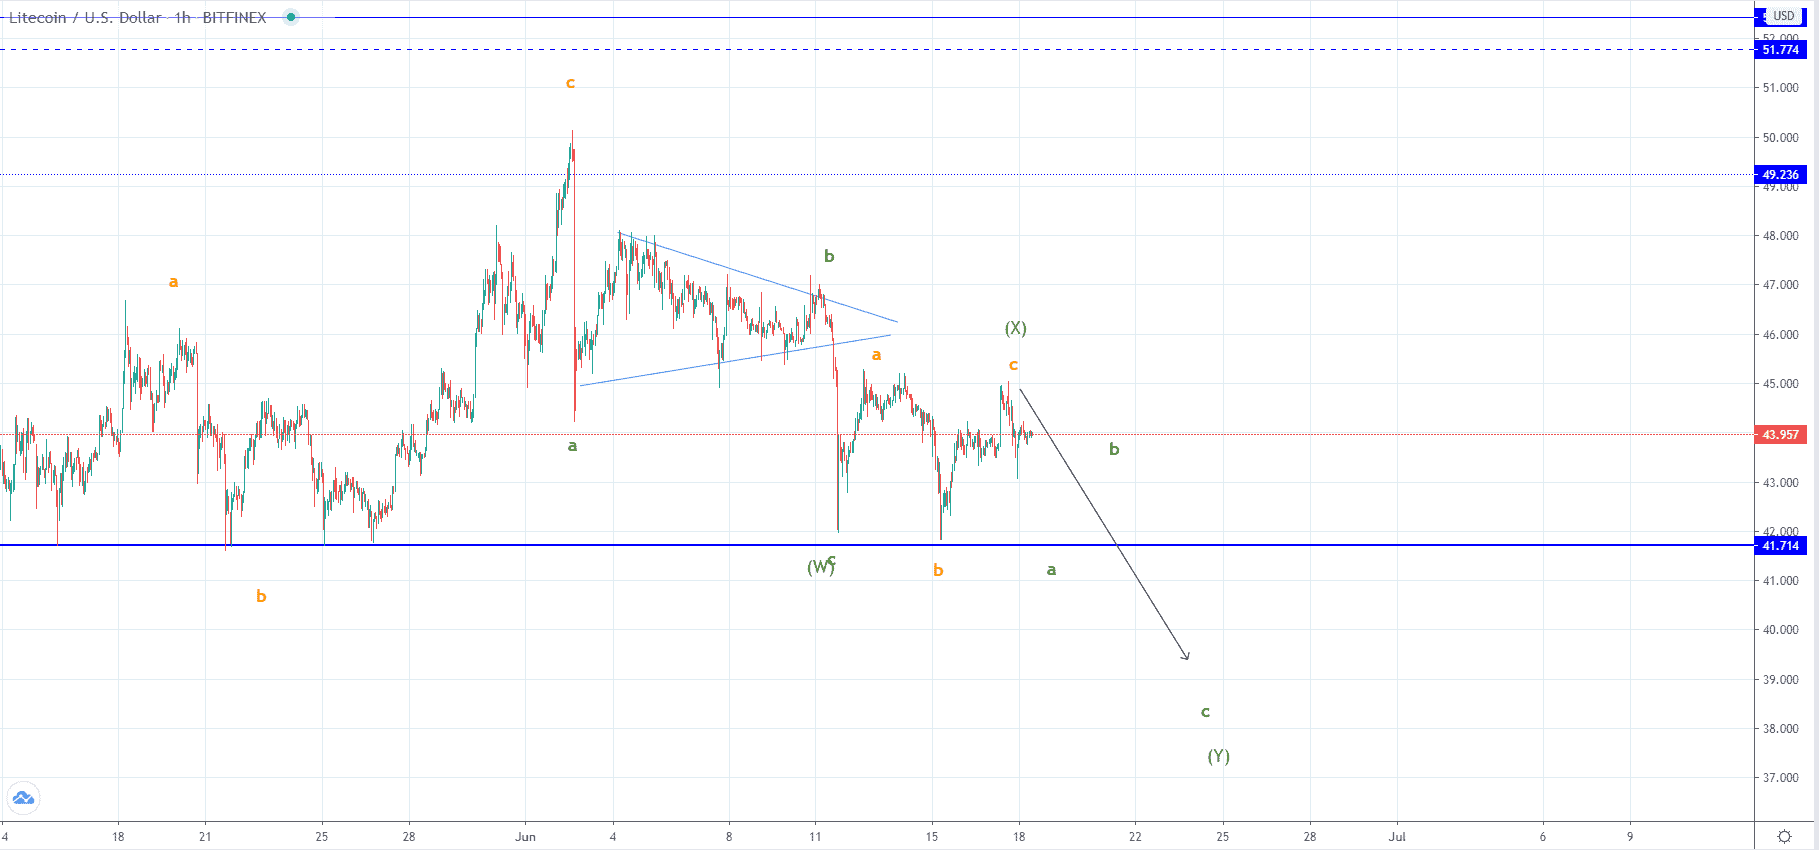 On the hourly chart, you can see that the price has stabilized around the local horizontal support level and is further establishing support after a three-wave move to the upside has been made. This three-wave move retested the $45 level twice before we have seen a descending one today. It came after an impulsive move to the downside which pushed the price in a decrease of 10.62% but there hasn’t been an interaction with the significant $41.7 horizontal level.
If we have seen a corrective ABC to the upside then it is most likely the 2nd sub-wave of the higher degree three-wave move to the downside and is why from here I would be expecting further downtrend continuation with a breakout below the mentioned significant horizontal support. The next significant support area in line to the downside would be at around $39.2 so I would be looking for the correctional higher degree count to end around it’s vicinity.
EOS/USD
The price of EOS has made a similar pattern as from Monday when a lower low was made to $2.424 we have seen an increase of 7.49% to $2.605 but another descending move followed as a three-wave upward correctional move developed.
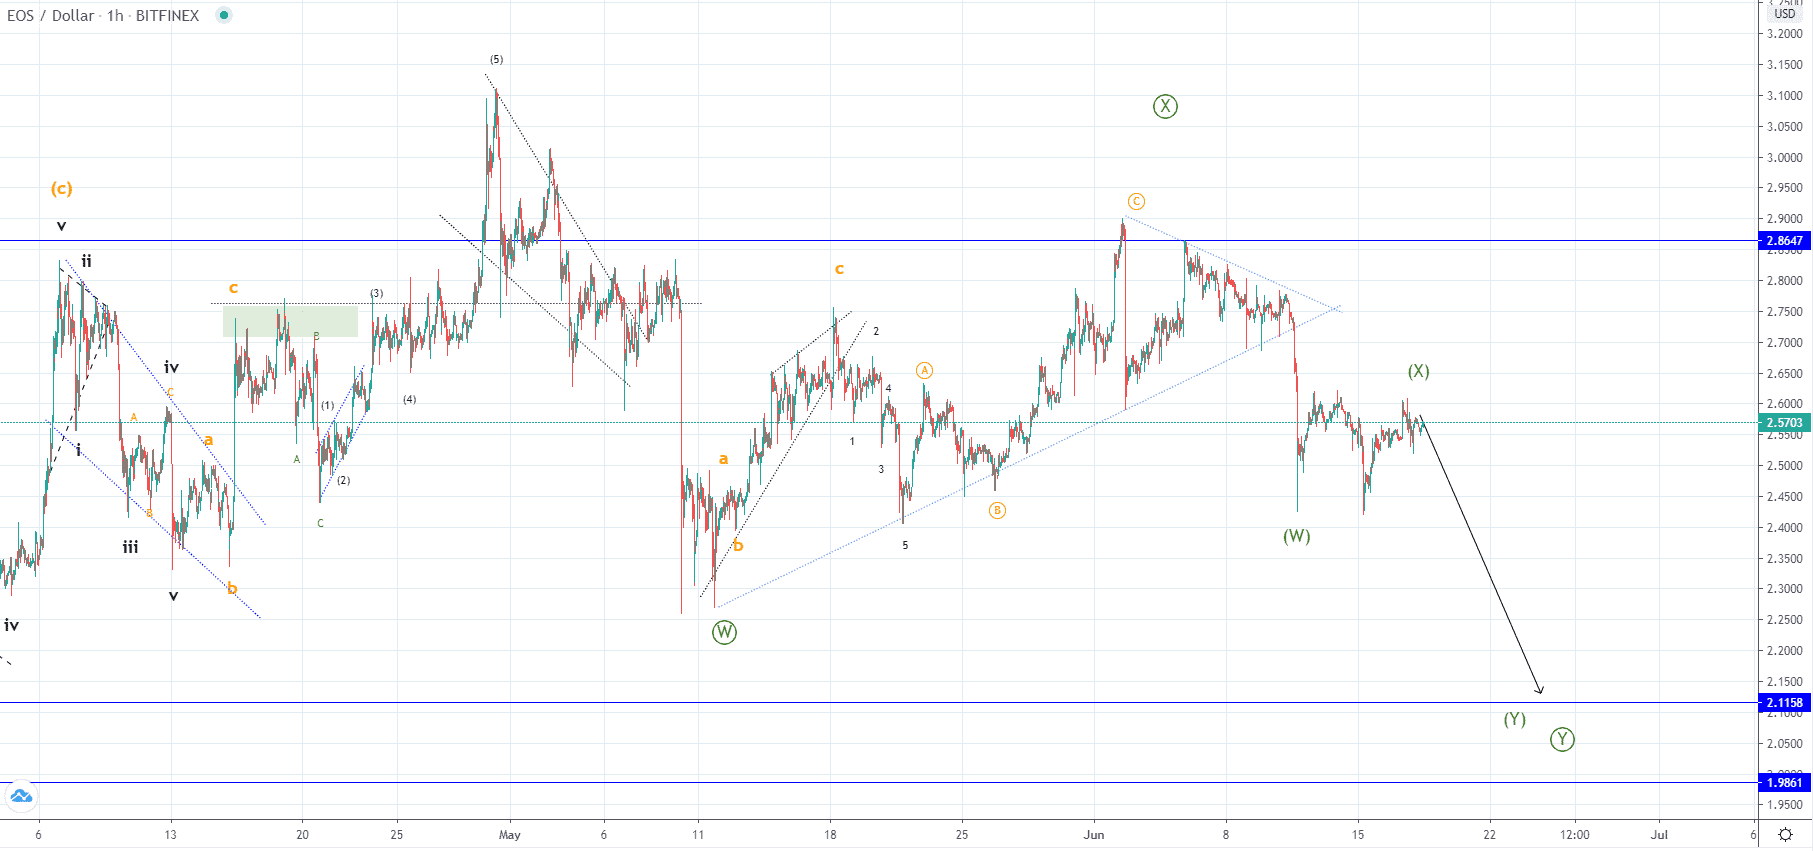 Looking at the hourly chart, you can see that like in the case of Litecoin the expected downside movement from the current levels is considered the 3rd of a higher degree count which is again the Y wave of an even higher degree correction that started since the beginning of May. This is why I would be expecting a significant decrease from the current levels potentially all the way down to the most significant horizontal area at around $2.1
If we are seeing the start of another descending move of a higher degree then it wouldn’t come down in a straight line, instead, we are to see the development of another ABC of a lower degree count with potentially the C wave being the most impulsive one to bring the price down in a sharp manner like it did on the 10th of May.
FXOpen offers the world's most popular cryptocurrency CFDs*, including Bitcoin and Ethereum. Floating spreads, 1:2 leverage — at your service (additional fees may apply). Open your trading account now or learn more about crypto CFD trading with FXOpen.
*Important: At FXOpen UK, Cryptocurrency trading via CFDs is only available to our Professional clients. They are not available for trading by Retail clients. To find out more information about how this may affect you, please get in touch with our team.
This article represents the opinion of the Companies operating under the FXOpen brand only. It is not to be construed as an offer, solicitation, or recommendation with respect to products and services provided by the Companies operating under the FXOpen brand, nor is it to be considered financial advice.
Stay ahead of the market!
Subscribe now to our mailing list and receive the latest market news and insights delivered directly to your inbox.


Latest articles

Market Analysis: GBP/USD Turns Bullish Again While EUR/GBP Drops More
GBP/USD is showing positive signs above 1.3440 and 1.3460. EUR/GBP declined and is now consolidating losses below 0.8680.
Important Takeaways for GBP/USD and EUR/GBP Analysis Today
· The British Pound started a fresh increase

Netflix 2026: Reversal on the Deal, Pullback on Earnings
Fundamental Background
At the end of February, Netflix withdrew from the bid for Warner Bros. Discovery assets after WBD’s board deemed Paramount Skydance’s $31-per-share offer more attractive. Netflix chose not to raise its own bid of $27.75