


LTC and EOS - Further lows are expected
FXOpen

LTC/USD
From Monday’s high at $55.776 the price of Litecoin has decreased by 15.34% measured to yesterday’s low at $47.218. Since then we have seen a minor recovery with the price currently being traded around $49.419.
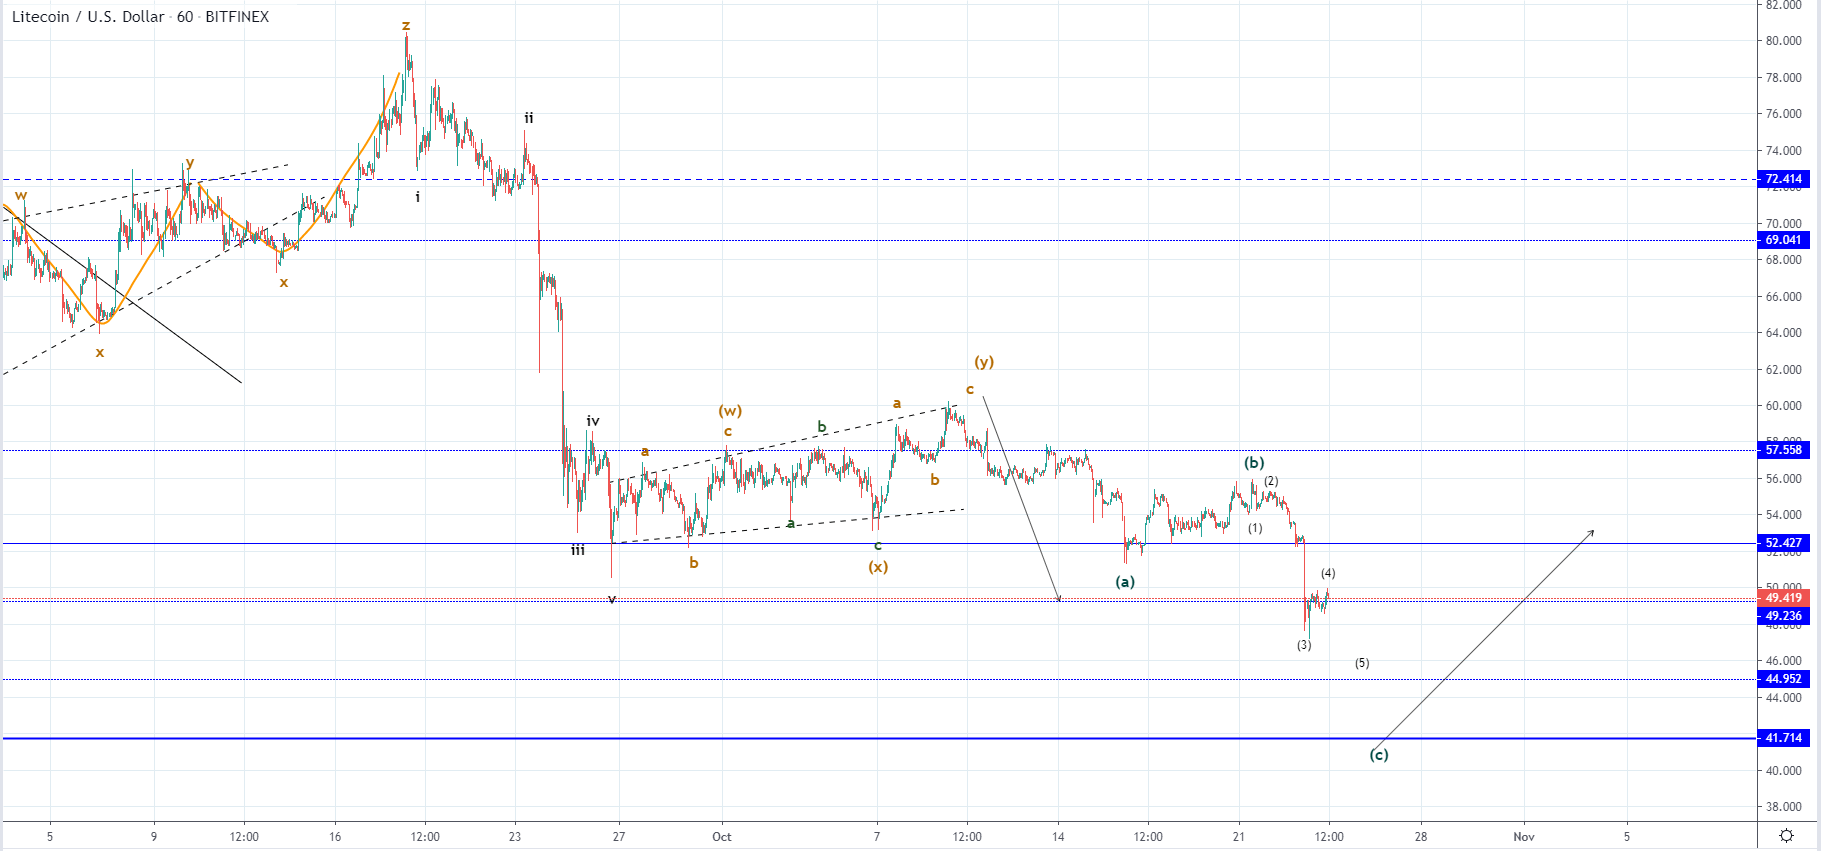 As you can see from the hourly chart above the price is currently interacting with the broken horizontal support level and is likely retesting it for resistance. This move to the current level was anticipated since the ending point of the ascending channel but now as it developed further lows could be expected as the C wave is to develop in a five-wave manner. The other possibility would be that we are seeing the start of an impulsive move altogether instead of the now presumed ABC move in which case the price could depreciate more.
The next horizontal level in line to the downside is at $44.952 but a more significant one is at $41.714 with whom we are more likely to see interaction as the ending point of the current decline. This level was major resistance in the period of price consolidation between December 2018 and February 2019 and prior to that served as the last horizontal support level off of the support zone which you can see from the daily chart below.
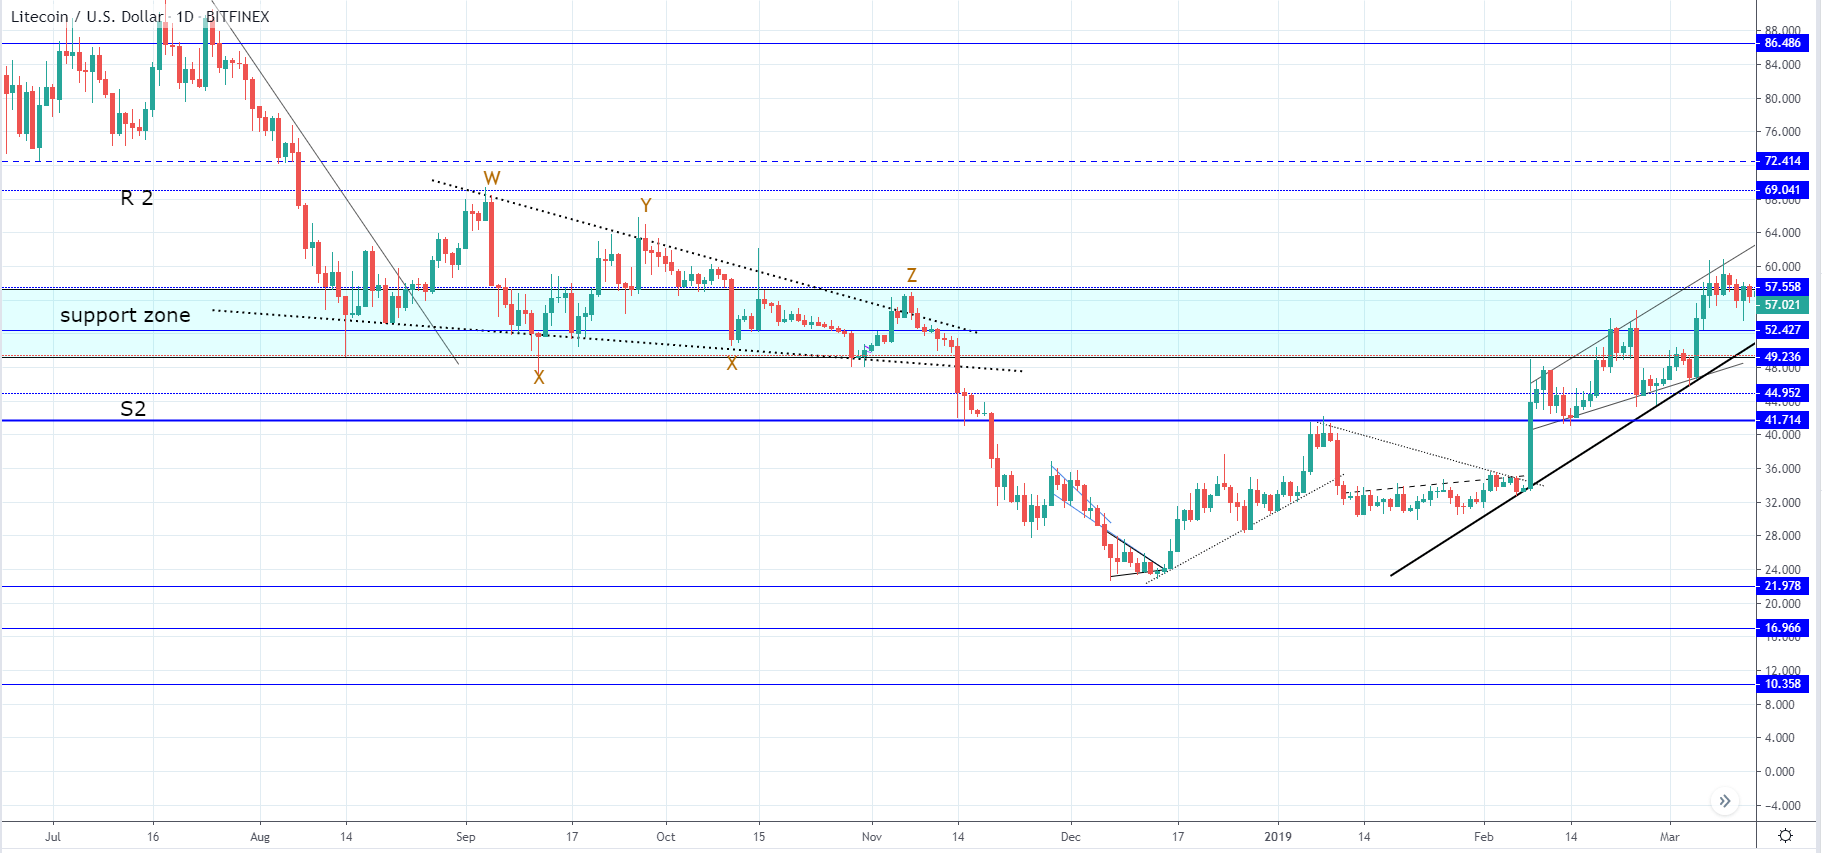
Because we have seen a breakout to the upside above the level after the mentioned consolidation period it’s retest for support would be a normal thing in price progression. But if the price goes below the level again which we are yet to see from the momentum of the expected decline, we could see the price back to the December 2018 low or even establish lower once.
EOS/USD
The price of EOS has decreased by 11.% from Monday’s high at $3 measured to today’s low at $2.6729 around which it is currently being traded. Looking at the hourly chart below you can see that the price was been decreasing in a five-wave manner from the rejection at the $3.2787 horizontal level and has formed a diagonal which could be the one of a leading kind which would be the first wave off of the higher degree five-wave move to the downside.
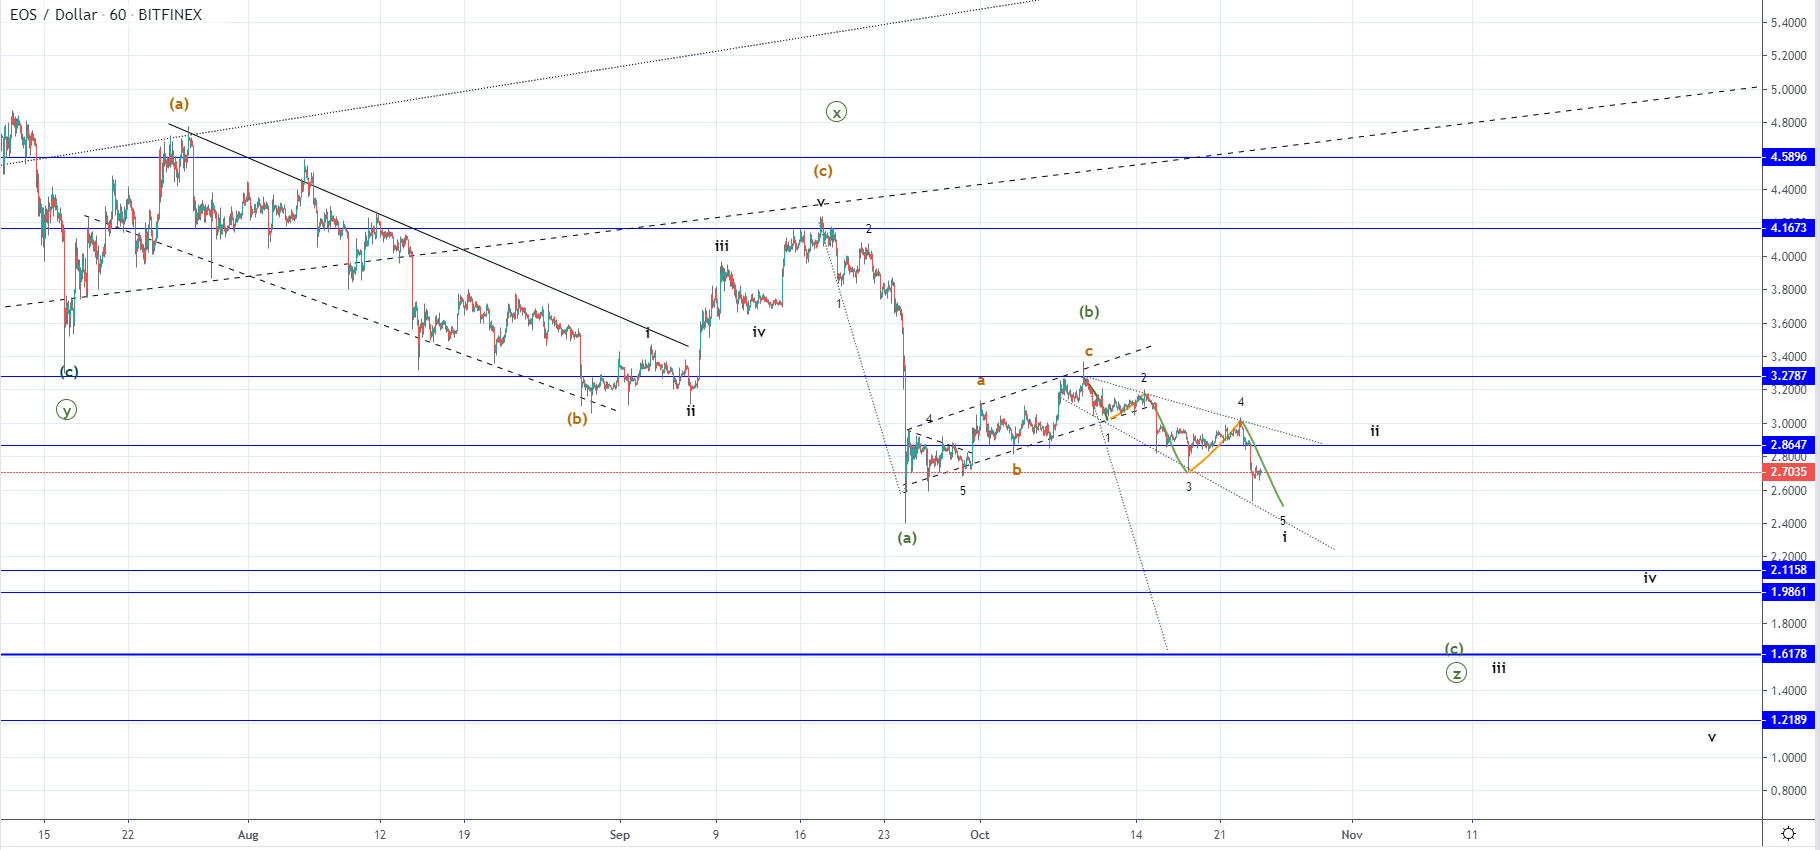
As previous to the formation of the descending channel, we have seen an ascending one which is considered a B wave the current move to the downside is labeled as a C wave which is expected to bring the price of EOS to some of the horizontal support levels below the one broken yesterday at $2.86.
The mentioned C wave would be the sub-wave of the Z wave from the higher degree five-wave move to the downside measured from the yearly high and would mark the end of the decline, but it is still unclear how will the Z wave develop. But we are seeing a leading diagonal the price could fall to $1.21 before the end of the decrease. However, if the price develops two more waves to the downside and ends its decline as a three-wave move the most optimal price target would be at the $1.6178 which would be a retest of the December’s low.
FXOpen offers the world's most popular cryptocurrency CFDs*, including Bitcoin and Ethereum. Floating spreads, 1:2 leverage — at your service (additional fees may apply). Open your trading account now or learn more about crypto CFD trading with FXOpen.
*Important: At FXOpen UK, Cryptocurrency trading via CFDs is only available to our Professional clients. They are not available for trading by Retail clients. To find out more information about how this may affect you, please get in touch with our team.
This article represents the opinion of the Companies operating under the FXOpen brand only. It is not to be construed as an offer, solicitation, or recommendation with respect to products and services provided by the Companies operating under the FXOpen brand, nor is it to be considered financial advice.
Stay ahead of the market!
Subscribe now to our mailing list and receive the latest market news and insights delivered directly to your inbox.


Latest articles

Amazon Earnings: Does the Chart Already Know Something the Numbers Don't?
All eyes are on July 30, when Amazon reports Q2 2026 earnings, with Wall Street increasingly convinced the bar has been set too low. Consensus sees EPS near $1.82-$2.26 on roughly $197 billion in revenue, but the

WTI Analysis: Gap Breaks Short-Term Trend as Price Remains Trapped Between the POC and Profile Boundary
WTI crude oil plunged by more than 7% on 27 July 2026 after the US suspended a series of strikes against Iran over the weekend, raising hopes of a diplomatic solution and the reopening of shipping through the Strait of

US Dollar Index: A Defining Week for the King of the Markets
The dollar heads into a pivotal week trading near 101.80, just off a 15-month high, with the Fed's July 29 meeting standing as the clear focal point. Markets currently price roughly a 65% chance of a hold, though renewed