


FXOpen

LTC/USD
The price of Litecoin has been moving sideways since a breakout to the downside was made from the ascending channel last week’s Thursday when it reached $48.5 at its highest peak. A decrease of 8.63% was made measured to the close of the hourly candle but the price moved even further to the downside coming to $43.2 at its lowest. Since last Friday’s low a recovery has been seen with the price coming close to it’s Thursday’s high but a quick spike to the upside ended with an equally strong impulsive move that led the price below its previous upside starting point and retested the $45.3 horizontal level.
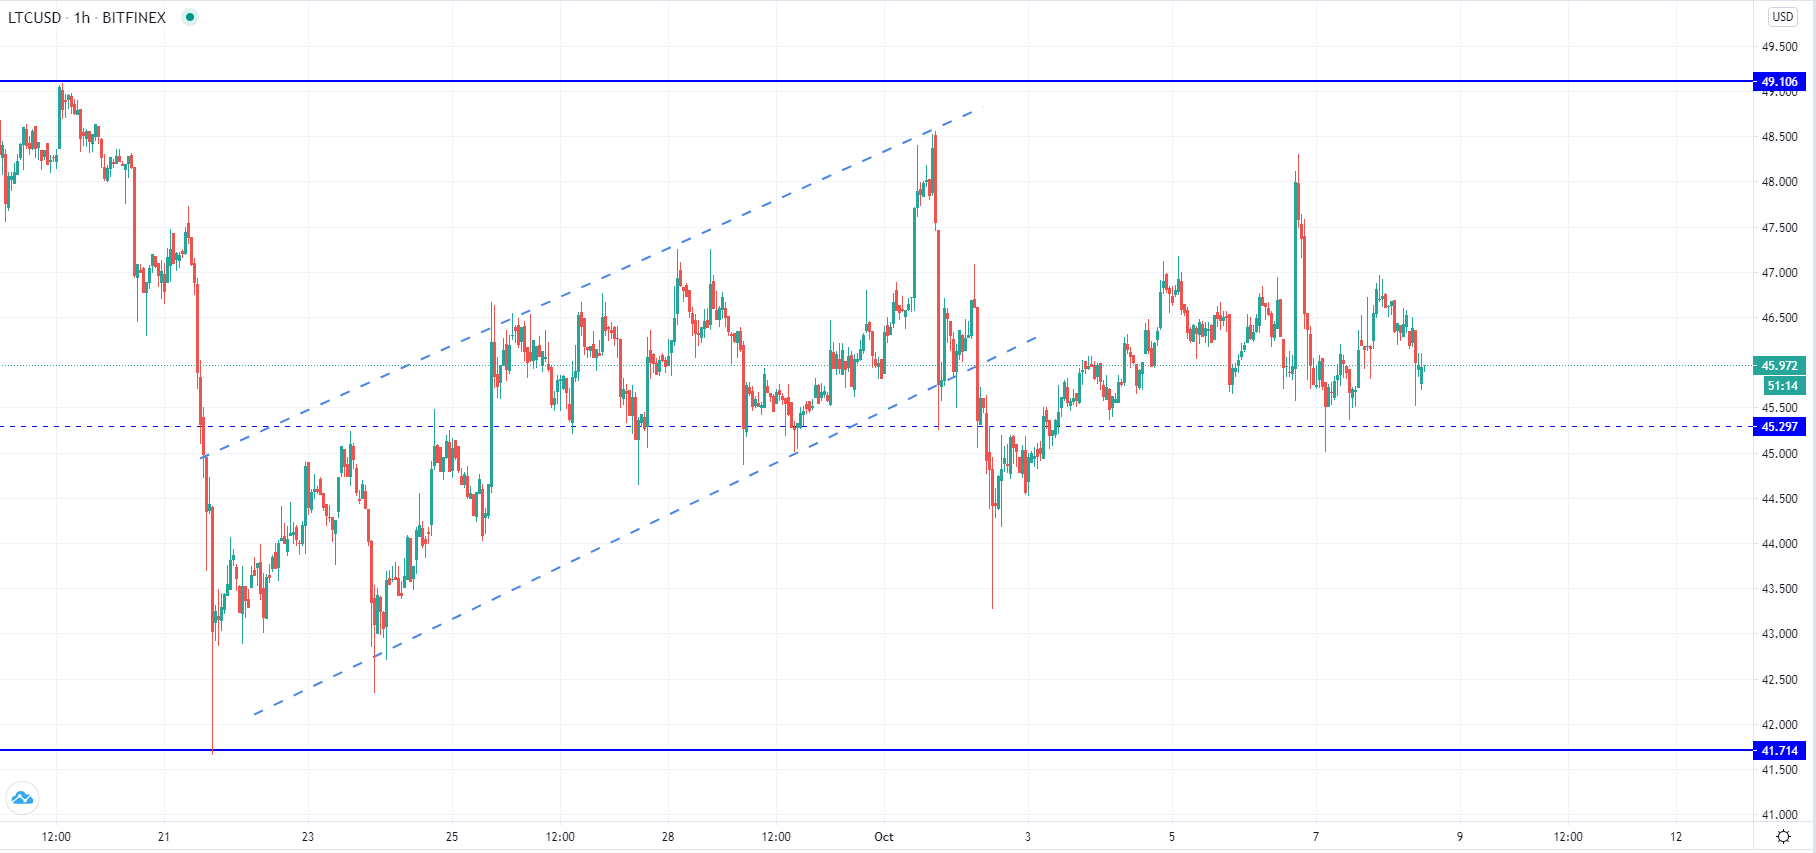
Looking at the hourly chart, you can see that from the retest of the horizontal zone another minor recovery has been seen but the price struggled to surpass its minor horizontal resistance at $46.8 and was rejected there once more. A higher low has been made today which could be interpreted as a bullish sign but we are yet to see if the price could catch enough momentum for a breakout to the upside and in a more sustainable uptrend.
As the sideways movement continues the price is likely to further test its currently support-resistance boundaries but it is still unclear whether or not it is going to stay above the $45.3 horizontal support zone as it was broken last Friday which is why the recovery seen from there could be corrective in nature.
EOS/USD
The price of EOS has spiked to $2.977 level on Tuesday from the $2.49 area where it found support, but since then made a decrease of 16.35% measured from its highest to its lowest spike which was made today around the levels of the Tuesday’s increase. From there the price has started recovering and is currently in an upward trajectory sitting at $2.5782.
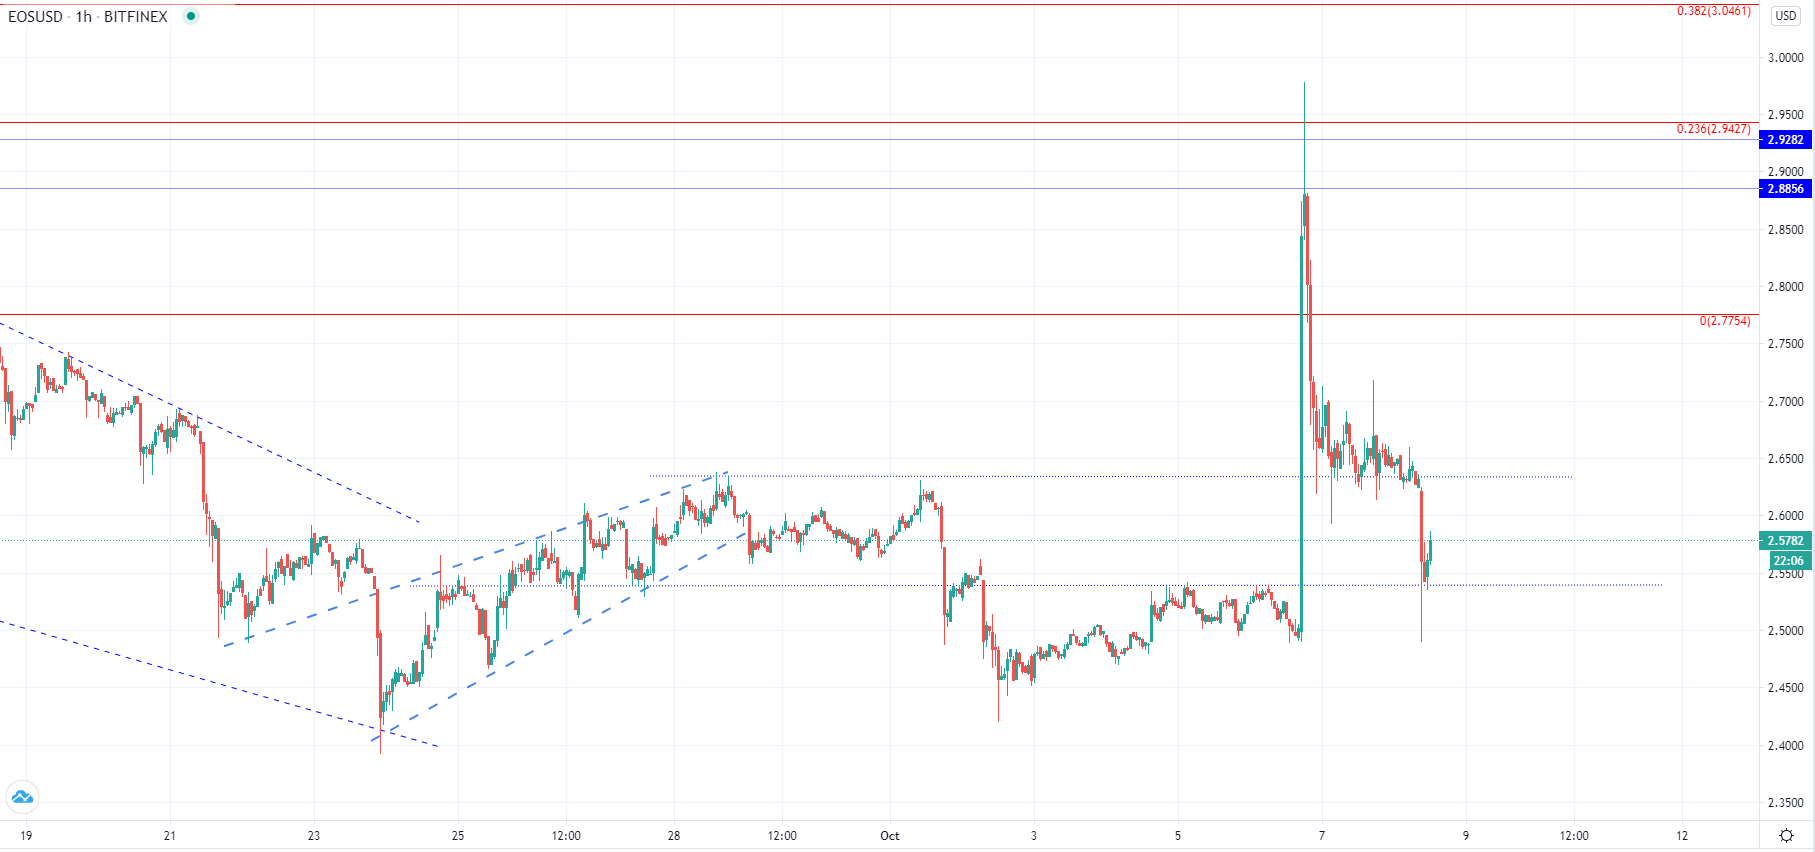
As a breakout was made below the minor horizontal support level at $2.63 we have seen another downfall to the next significant horizontall level where the price found support and closed on the hourly candle. A higher low was made compared to the Tuesday’s one which could indicate that the buyers are willing to chase the price and their presence has been also seen on Tuesday, but the sellers are still looking like they are maintaining control.
Now as the price is in an upward trajectory an interaction with the $2.63 level is expected out of which we are going to see if there is more upside potential for the price of EOS which is why this level now serves as a pivot point.
FXOpen offers the world's most popular cryptocurrency CFDs*, including Bitcoin and Ethereum. Floating spreads, 1:2 leverage — at your service. Open your trading account now or learn more about crypto CFD trading with FXOpen.
*At FXOpen UK and FXOpen AU, Cryptocurrency CFDs are only available for trading by those clients categorised as Professional clients under FCA Rules and Professional clients under ASIC Rules respectively. They are not available for trading by Retail clients.
This article represents the opinion of the Companies operating under the FXOpen brand only. It is not to be construed as an offer, solicitation, or recommendation with respect to products and services provided by the Companies operating under the FXOpen brand, nor is it to be considered financial advice.
Stay ahead of the market!
Subscribe now to our mailing list and receive the latest market news and insights delivered directly to your inbox.

Latest articles

Weekly Market Wrap With Gary Thomson: Nasdaq, EUR/USD, USD/CHF, Brent Crude Oil, Googl Shares
Get the latest scoop on the week's hottest headlines, all in one convenient video. Join Gary Thomson, the COO of FXOpen UK, as he breaks down the most significant news reports and shares his expert insights.
- Nasdaq Composite: Worst Session

Analysis of AUD/USD: Exchange Rate Falls to Early May Low
As indicated by the 4-hour AUD/USD chart today:
→ the rate fell below 0.652, a level last seen on May 2;
→ the RSI indicator dropped below 15, a level last seen during the panic over the spread of COVID-19

Analysis of AMZN Stock: Price at 1.5-Month Low
As shown in the AMZN chart, the stock price dropped below:
→ the psychological level of $180;
→ the mid-June interim low.
The last time AMZN traded below $180 was in early June.
Thus, AMZN has faced sell-offs, similar to other tech