


LTC and EOS - Further Upside Anticipated
FXOpen

LTC/USD
From Sunday when the price of Litecoin was sitting at around $40.8 at its lowest point we have seen an increase of 12.26% measured to ti’s highest point today which was at $45.9. We have seen the price coming to the levels above its previous horizontal resistance but is still in the zone and is retesting its upper level which is why in the last hour we have seen a red candle developing and the momentum slowing down.
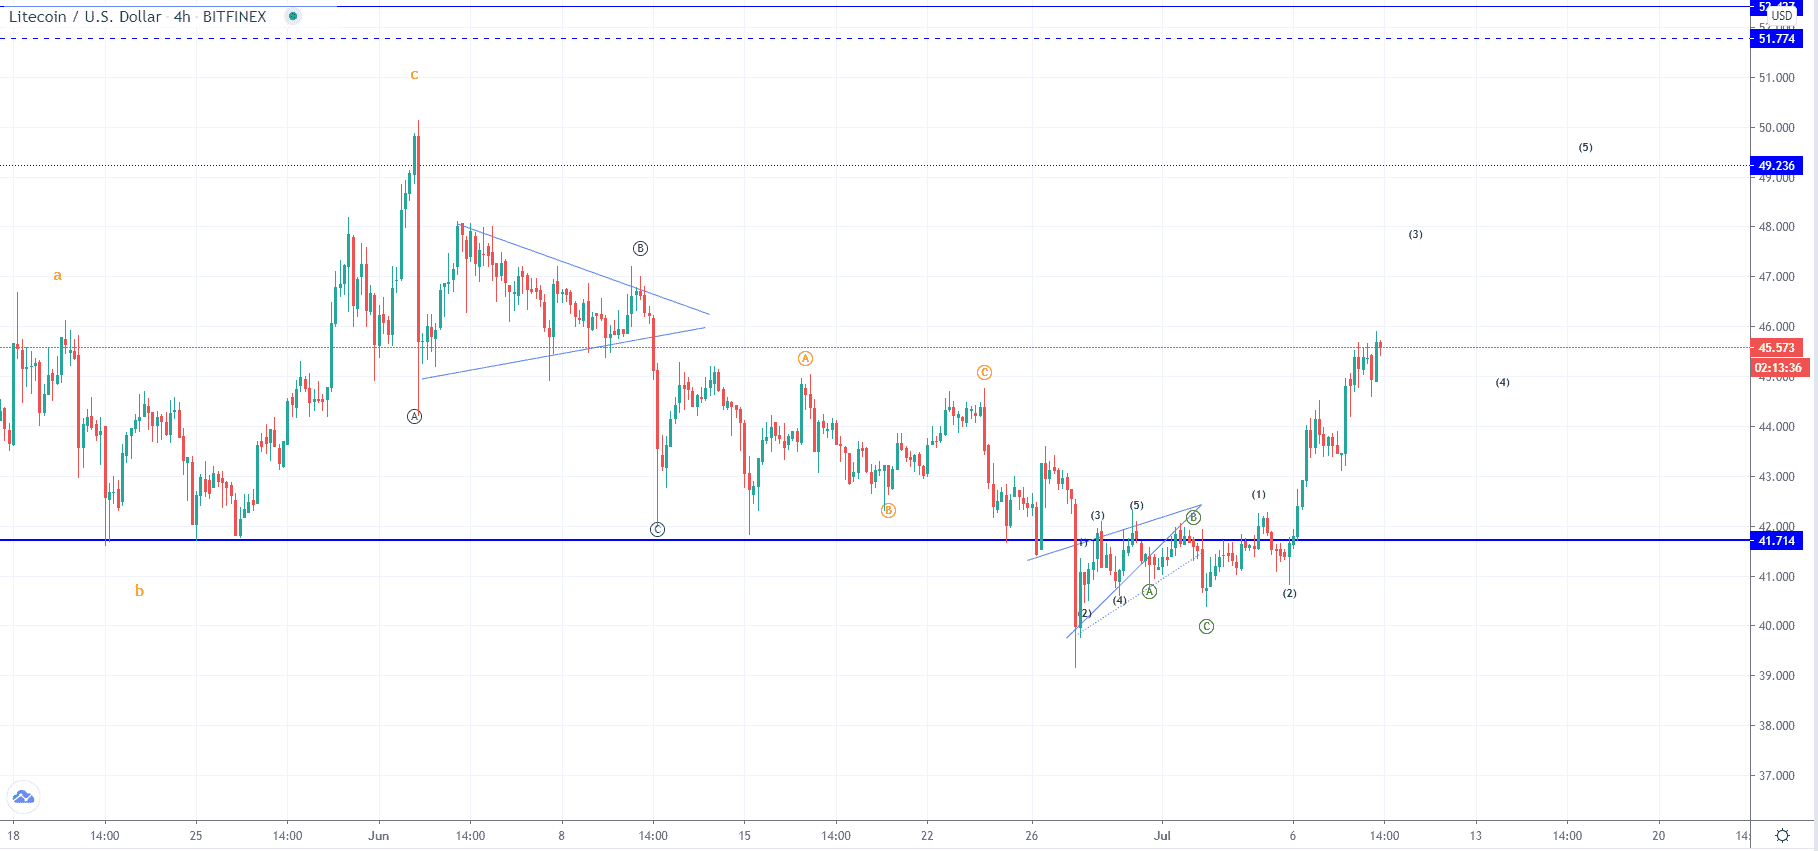 On the hourly chart, you can see that the price made a bullish spikey upside move after falling below the $41.7 which was the most significant horizontal support level. This invalidated the prior count in which we have been likely seeing the development of another five-wave move to the downside. Instead, we are now seeing a five-wave increase to the upside and with the price of Litecoin showing strong bullish momentum, it is likely to continue for a while as further waves should develop.
If this is true then we could see a retest of the prior higher high where the C wave of the higher degree ABC to the upside is around the $49.2 horizontal resistance but this increase could still be corrective in nature as we have seen the completion of the descending move in an impulsive manner after which a leading diagonal has been seen before this current upside movement. This leading diagonal could be it’s A wave in which case the current upward impulse could be another C wave from the upward ABC.
In either was from here we are most likely to see further uptrend continuation from who’s momentum and strength we are going to evaluate this possibility, but most importantly from the descending move that is coming after.
EOS/USD
The price of EOS has been following the market trend and has been in an upward trajectory, increasing by 13.57% from Sunday’s low at $2.4 to $2.73 at its highest point today around which the price is still currently being traded.
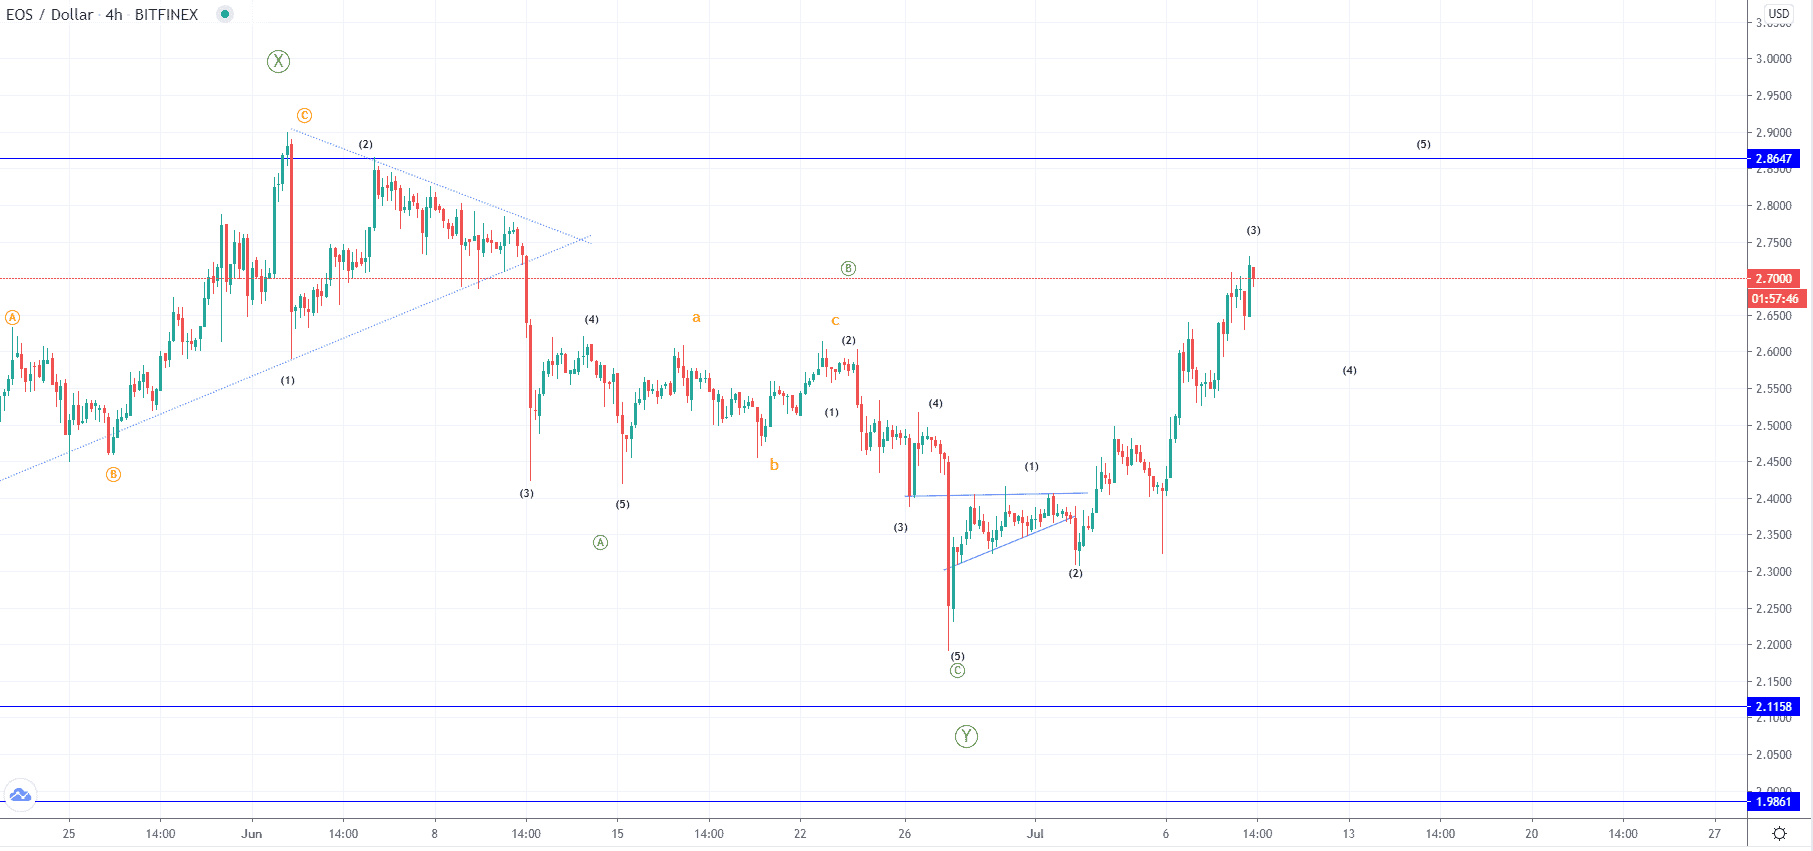 Looking at the hourly chart, you can see that our count has been adjusted as the prior in which we were expecting to see a lower low before the end of the descending move was invalidated. This is because the price most likely ended it’s last ABC correction on the 27th of June. If this marked the completion of the Y wave of a higher degree we could be seeing the 1st wave out of the next impulsive move to the upside but it is still unclear whether or not this move would still be corrective in a higher degree count, as the previous corrective structure could be prolonged by two more waves X and Z.
Like in the case of Litecoin we would be expecting a retest of the prior higher high at around $2.86 before the completion of this current increase.
FXOpen offers the world's most popular cryptocurrency CFDs*, including Bitcoin and Ethereum. Floating spreads, 1:2 leverage — at your service (additional fees may apply). Open your trading account now or learn more about crypto CFD trading with FXOpen.
*Important: At FXOpen UK, Cryptocurrency trading via CFDs is only available to our Professional clients. They are not available for trading by Retail clients. To find out more information about how this may affect you, please get in touch with our team.
This article represents the opinion of the Companies operating under the FXOpen brand only. It is not to be construed as an offer, solicitation, or recommendation with respect to products and services provided by the Companies operating under the FXOpen brand, nor is it to be considered financial advice.
Stay ahead of the market!
Subscribe now to our mailing list and receive the latest market news and insights delivered directly to your inbox.


Latest articles

USD/JPY and USD/CHF Near Key Levels: The Dollar Supported by the Fed
The US dollar continues to trend upwards following the Federal Reserve meeting, drawing support from the regulator’s moderately hawkish stance and comments by Jerome Powell. Markets interpret the Fed’s rhetoric as a signal that restrictive policy is likely

EUR/USD and GBP/USD consolidate ahead of the Fed decision
European currencies are showing subdued dynamics, entering a consolidation phase following their previous advance. Earlier, EUR/USD and GBP/USD broke out of their ranges and strengthened; however, the subsequent correction has led both pairs to retest the previously breached

Meta: V-Shaped Recovery Meets Heavy Volume Resistance
The movement in Meta Platforms shares is being driven by two competing narratives. On one hand, advertising revenue is benefiting from AI-based tools: the Advantage+ platform continues to support strong advertiser demand, and the analyst consensus for Q1 2026 revenue