


LTC and EOS - Impulse to the downside seen
FXOpen

LTC/USD
The price of Litecoin has been decreasing since yesterday’s high at $44 and made a downfall of 7.21% coming to $40.81 at its lowest point today slightly above which it is currently being traded.
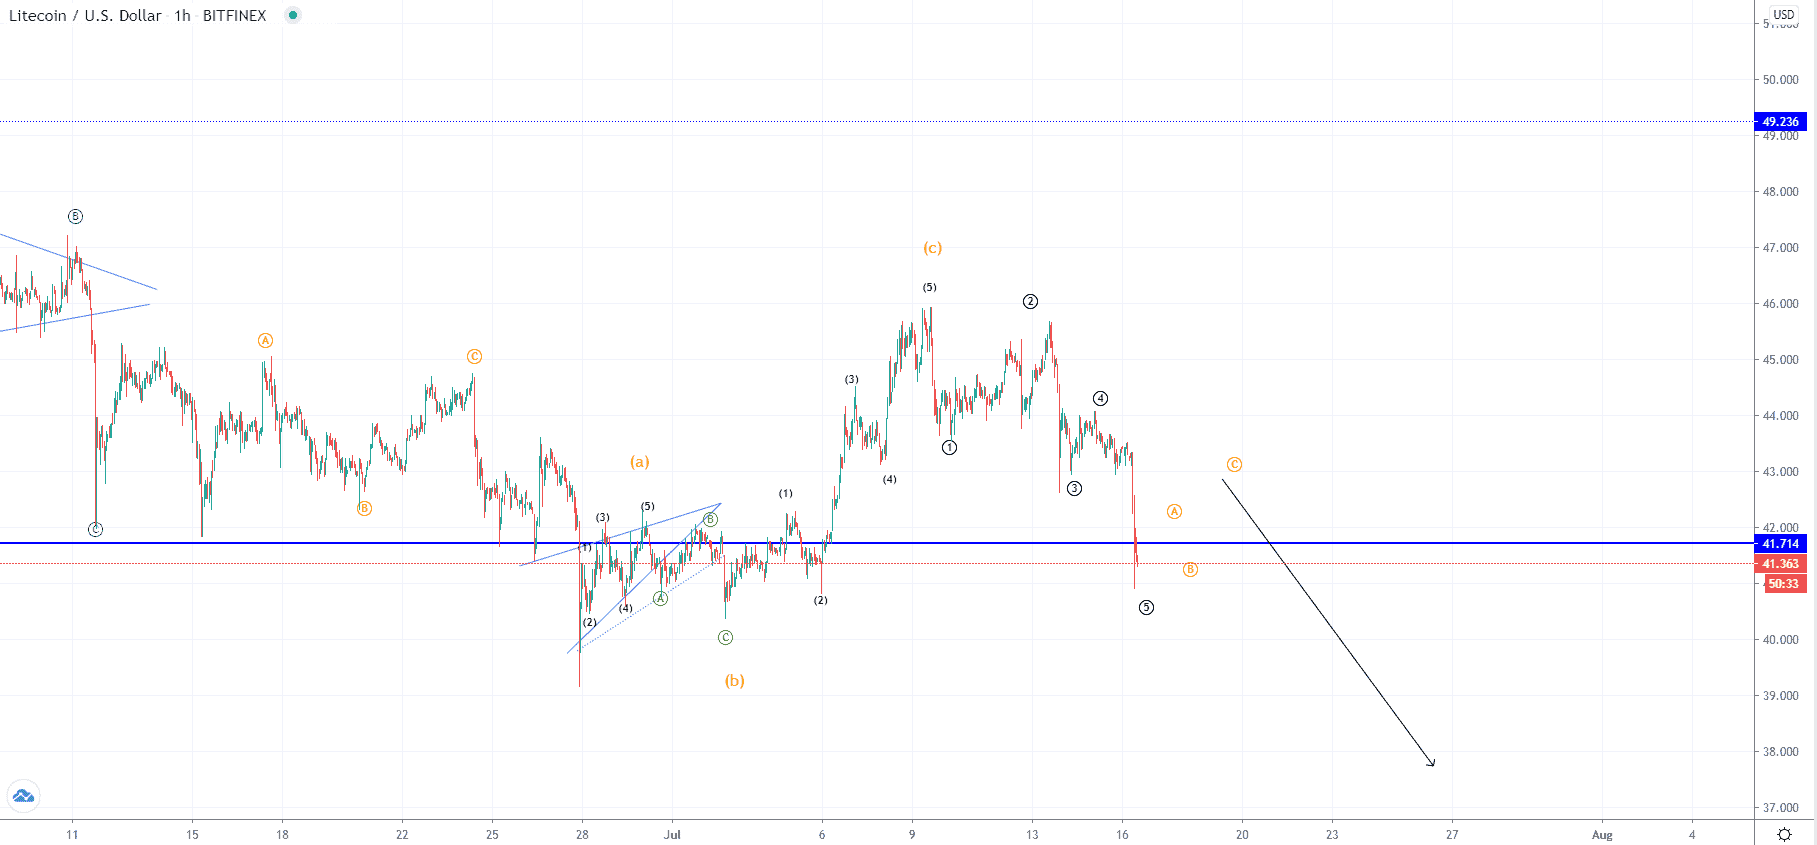 On the hourly chart, you can see that the price has fallen below the significant horizontal level at $41.7 and entered the territory of the 1st wave from the previous five-wave impulse count. That five-wave impulse to the upside ended on the 9th of July after which we have seen another five-wave move to the downside which indicates that that previous structure has ended as an ABC to the upside and that the next one of a higher degree to the downside has started.
As we have most likely seen the completion of the first sub-wave of the next descending structure or the price action is getting close to its completion I would now expect to see a corrective move to the upside of the same degree before the price continues for another five-wave move in a downward trajectory. This next anticipated move to the downside should be either the C wave from the next three-wave move or the 3rd wave out of the higher degree impulse wave but in ether way the price of Litecoin is likely headed down in the upcoming period.
EOS/USD
From last Thursday when the price of EOS has been sitting on its highest point at $2.73 we have seen a decrease of 11% measured to its lowest point today made at $2.432. At the moment the price is being traded slightly higher but has made a steep downfall from the yesterdays high and is still in a downward trajectory.
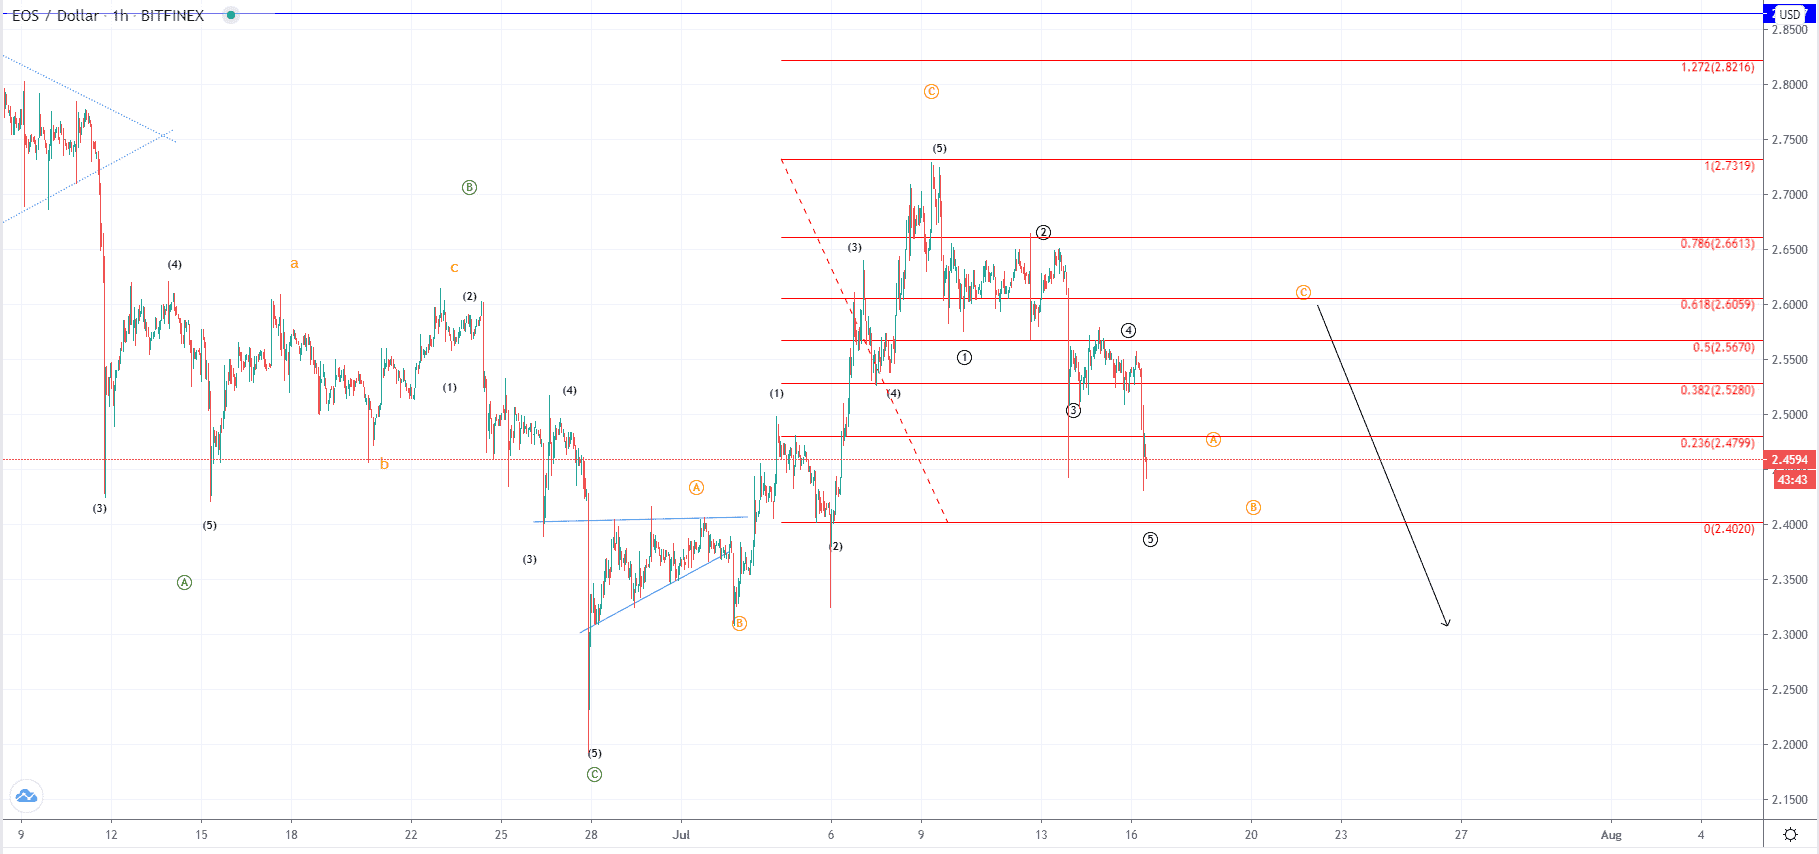 Looking at the hourly chart, you can see that like in the case of Litecoin we have seen the completion of the five-wave move to the upside followed by the development of the five-wave move to the downside. This indicates that the previous structure with the ascending triangle from the 28th of Jun was another ABC to the upside which is why after it ended another round of impulsive downside movement has been seen.
It is likely that the decrease is to continue for a bit longer most likely to retest the area around the A wave’s ending point around $2.4 level before some recovery could be seen, but after it ends I would expecting further downtrend continuation for the price of EOS.
FXOpen offers the world's most popular cryptocurrency CFDs*, including Bitcoin and Ethereum. Floating spreads, 1:2 leverage — at your service (additional fees may apply). Open your trading account now or learn more about crypto CFD trading with FXOpen.
*Important: At FXOpen UK, Cryptocurrency trading via CFDs is only available to our Professional clients. They are not available for trading by Retail clients. To find out more information about how this may affect you, please get in touch with our team.
This article represents the opinion of the Companies operating under the FXOpen brand only. It is not to be construed as an offer, solicitation, or recommendation with respect to products and services provided by the Companies operating under the FXOpen brand, nor is it to be considered financial advice.
Stay ahead of the market!
Subscribe now to our mailing list and receive the latest market news and insights delivered directly to your inbox.


Latest articles

WTI Analysis: Gap Breaks Short-Term Trend as Price Remains Trapped Between the POC and Profile Boundary
WTI crude oil plunged by more than 7% on 27 July 2026 after the US suspended a series of strikes against Iran over the weekend, raising hopes of a diplomatic solution and the reopening of shipping through the Strait of

US Dollar Index: A Defining Week for the King of the Markets
The dollar heads into a pivotal week trading near 101.80, just off a 15-month high, with the Fed's July 29 meeting standing as the clear focal point. Markets currently price roughly a 65% chance of a hold, though renewed

NZD/USD: Inflation Surge Meets Strong US Dollar Pressure
On 21 July, Stats NZ reported an acceleration in inflation: the Consumer Price Index rose 1.5% in the second quarter, while the annual inflation rate climbed to 4.1%, its highest level in more than two years and slightly